


Volume 22, No.1 Pages 14 - 16
1. 最近の研究から/FROM LATEST RESEARCH
(SPRUC 2015 Young Scientist Award受賞 研究報告)
Imaging the Airway Surface to Test Cystic Fibrosis Treatments
[1]School of Physics, Monash University、[2]Institute of Advanced Studies & Chair of Biomedical Physics, Technische Universitat Munchen、[3]Women's and Children's Hospital, North Adelaide & Robinson Institute, University of Adelaide
The genetic condition Cystic Fibrosis affects the body in a number of ways, most devastatingly in the form of progressive early-fatal lung disease. This lung disease is largely caused by an inability to effectively clear inhaled debris and bacteria along the airway surface and out of the lungs. Key to this clearance is the airway surface liquid (ASL) that lines the airways at a depth of only a few microns, enabling cilia along the airway surface to beat in coordination, transporting mucus and debris away from the lungs. In Cystic Fibrosis, the ASL is dehydrated and decreased in depth, compromising these mechanisms. A variety of existing and new airway treatments aim to increase this ASL depth to reverse the defective transport processes, but it is difficult to verify treatment success in vivo. Some treatment testing is done using excised airway epithelium sections, or airway tissue cultures, but these do not completely model the state of the airway in vivo. Other tests examine changes in lung function, but these quantify overall lung health, and these measures typically do not change until several months after treatment delivery, meaning that treatment testing can be very slow and logistically difficult.
In this project, we developed and applied a non-invasive method of airway imaging to observe treatment-induced changes in the ASL depth in mouse airways in real time[1,2][1] K. S. Morgan, M. Donnelley, N. Farrow, A. Fouras, N. Yagi, Y. Suzuki, A. Takeuchi, K. Uesugi, R. Boucher, K. Siu, D. Parsons: Am. J. Resp. Crit. Care Med. 190, p.469-472 (2014).
[2] K. S. Morgan, M. Donnelley, D. M. Paganin, A. Fouras, N. Yagi, Y. Suzuki, A. Takeuchi, K. Uesugi, R. C. Boucher, D. W. Parsons and K. K. W. Siu: PLoS ONE 8, p.e55822 (2013).. This new method enables immediate, quantitative and direct feedback on treatment effectiveness in airways while they are in normal operation within the body.
These measurements were enabled by phase contrast, a mode of X-ray imaging that reveals not only bone structure, but also details of soft tissue structures like the airways. This method analyses the phase of the X-ray wavefield and has been developed at high coherence synchrotron sources. Quantitative sample images can be reconstructed by relating variations in X-ray phase to the refractive properties of the sample. The significant differences in refractive properties between tissue and air means the air-filled lungs and airways are particularly suited to phase contrast X-ray imaging.
We utilized the high flux of the undulator synchrotron beamline BL20XU to capture short exposure image sequences of the airway surface in mice. In order to track micron-sized changes in the airway surface liquid depth, the selected field of view was 721 micron by 497 micron. To avoid blur from respiratory motion, exposures were only 100 ms long and image capture was synchronized to the end of expiration (the most stationary point of the breath cycle), achieved using a small animal ventilator. The mouse was anaesthetized during the experiment and its health was remotely monitored using temperature and ECG. In order to best reveal the details of the airway, fur was removed from the neck area surrounding the relevant airways.
We have also used this set-up to image the motion of inhaled particles along the surface of the airways[3][3] M. Donnelley, K. S. Morgan, K. K. W. Siu, A. Fouras, N. Farrow, R. Carnibella and D. Parsons: J. Synchrotron Rad. 21, p.768 (2014).. For those experiments, we visualized the phase effects by introducing a distance of approximately 1 meter between the animal and the detector. This mode of phase contrast imaging is referred to as "propagation-based", and results in edge-enhancement at the air/tissue interfaces, as well as at the edges of any inhaled or resident particles.
While there is this strong edge enhancement seen at the air to liquid boundary, the ASL-tissue boundary is too subtle and is not visible in the propagation-based phase contrast image, as seen in Fig.2(a). Therefore propagation-based phase contrast is not sufficiently sensitive to differentiate the airway surface liquid from the underlying tissue. In order to increase the sensitivity of the system, we introduced a fine grid immediately upstream of the mouse, as seen in Fig.1. By tracking sample-induced distortions to the grid-and-airway image (Fig.2(b)), we can extract a 'differential' contrast image (Fig.2(c)). This differential image is more sensitive to subtle changes in the refractive index of the sample, and hence the ASL-tissue boundary can be located (Fig.2(c)). This type of phase contrast imaging can be referred to as single-grid imaging and can use an absorption[4][4] K. S. Morgan, D. M. Paganin and K. K. W. Siu: Opt. Express 19, p.19781-19789 (2011). or phase[5][5] K. S. Morgan, P. Modregger, S. C. Irvine, S. Rutishauser, V. A. Guzenko, M. Stampanoni, C. David: Opt. Lett. 38, p.4605-4608 (2013). grid, or a random phase object like a piece of paper, to provide a reference pattern at the detector.
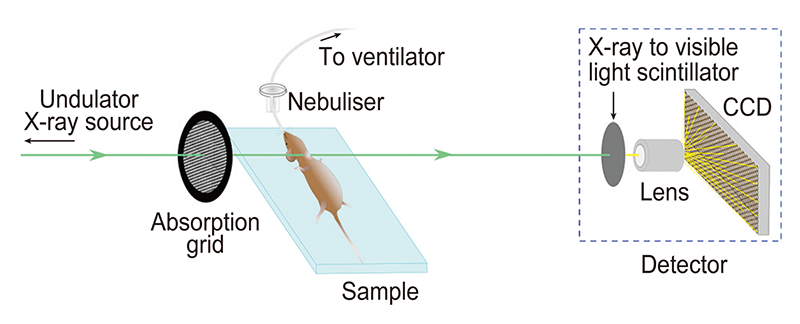
Figure 1 Experimental setup.
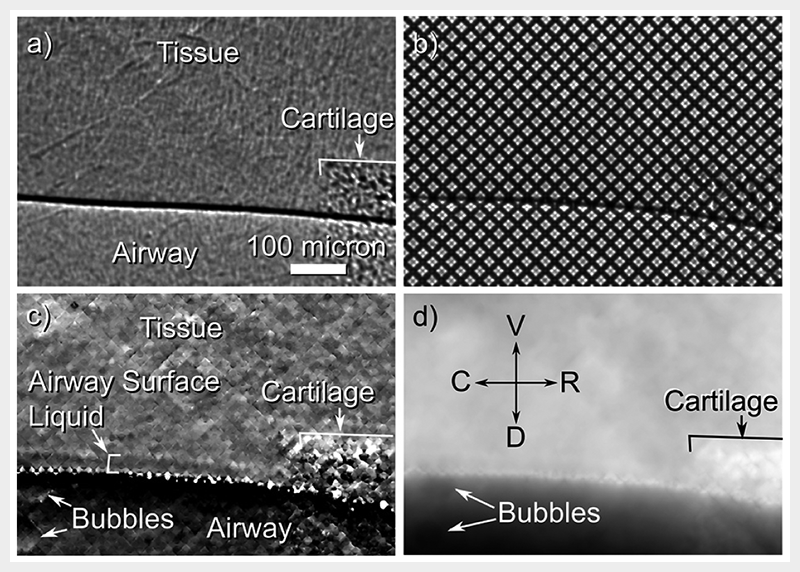
Figure 2 (a) Propagation-based phase contrast X-ray imaging of the airway surface is not sufficiently sensitive to differentiate tissue from airway surface liquid. (b) When a grid is placed in front of the airway, sample-induced distortions can be tracked to recover. (c) a differential image that shows the airway surface liquid. (d) The projected thickness of the airway can also be reconstructed, with reference directions shown as V = ventral, D = dorsal, C = caudal and R = cranial.
Single-grid phase contrast X-ray imaging satisfies the requirements of this application in that it is both sufficiently sensitive to differentiate ASL from tissue and sufficiently fast to avoid image blur often present in a living animal. Importantly, only a single exposure is required to capture the relevant detail of the ASL depth. In comparison, some phase contrast techniques require multiple and/or long exposures to reconstruct an image, rendering them incompatible with respiratory motion and (non-repetitive) biological changes, present in this situation (and exaggerated with such a small field of view).
To measure ASL depth a reference image of the grid was captured before the mouse was introduced to the field of view. Airway-and-grid images could then be locally compared to the reference grid-only image using a local cross-correlation to track how far each part of the image is transversely shifted due to the presence of the sample[4][4] K. S. Morgan, D. M. Paganin and K. K. W. Siu: Opt. Express 19, p.19781-19789 (2011).. As seen in Fig.2(b), these shifts are usually of the order of 0 to 8 pixels, hence the peak of the cross-correlation is interpolated to measure shifts with precision better than one pixel[5][5] K. S. Morgan, P. Modregger, S. C. Irvine, S. Rutishauser, V. A. Guzenko, M. Stampanoni, C. David: Opt. Lett. 38, p.4605-4608 (2013).. The magnitude of these shifts in a given direction is then plotted across the image to provide a differential image, as seen in Fig.2(c) where shifts in the vertical direction are shown. The differential images can then be integrated together and scaled to give the total tissue thickness[4][4] K. S. Morgan, D. M. Paganin and K. K. W. Siu: Opt. Express 19, p.19781-19789 (2011)., shown in Fig.2(c), which looks more like a conventional X-ray image.
Once the mouse was positioned in the X-ray beam, images were captured at time points separated by 3 minutes, with the first data point immediately prior to treatment delivery. The treatment, delivered as an aerosol, was a combination of 7% hypertonic saline (HS) and HS-P308, a long-acting epithelial sodium channel blocker (P308; Parion Sciences, Durham, NC) used at a concentration of 1 mM. The same volume of isotonic saline was used as a control. Ten images were taken at each time point to minimize variability and avoid problems with motion blur. ASL depth measurements were made by manually tracing both the tissue-to-ASL and ASL-to-air interfaces in the vertical differential contrast images (e.g. Fig.2(c)), then measuring the distance between these traces in software, taking the average of all (roughly 3000) measurements along the length of the airway edge available in the image. Because the isotonic saline produced minimal changes, it was difficult to definitively measure the ASL depth in these images, hence the distance between the uppermost boundary of the cartilage and the ASL-to-air boundary was measured as an indicator of changes in ASL depth, as shown in Fig.3(a). A statistically significant increase in surface position was observed for time points greater than 6 minutes from HS-P308 treatment delivery, with no return-to-normal observed within the imaging period (p < 0.05, repeated-measure ANOVA). There was also an increase in ASL depth noted at 9 and 12 minutes post-treatment-delivery, indicating treatment had been effective for that period.
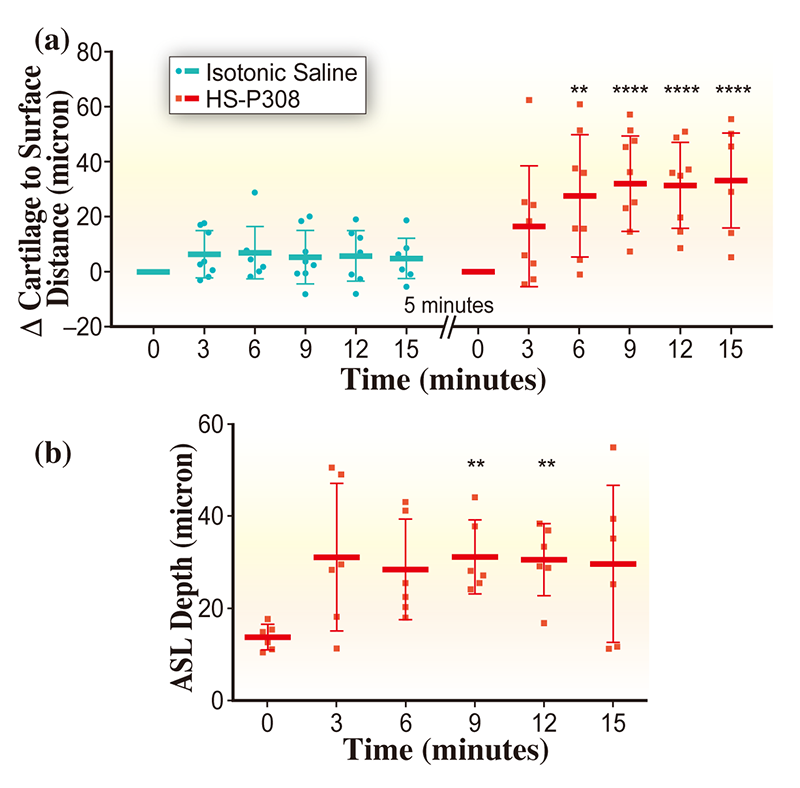
Figure 3 Measurements of (a) airway surface position and (b) ASL depth, with stars indicating statistical significance (** indicates p ≤ 0.01 and **** indicates p ≤ 0.0001), with treatment delivered immediately after t = 0 minutes. Horizontal bars indicate mean measurement at that time point, with tails showing the standard deviation in measurements.
This imaging technique can now be used to test the effectiveness and duration of effect of new airway rehydrating treatments in animal models in vivo. Future studies will use repeat-imaging over extended periods of time in the same animals to assess long-term treatment effects[3][3] M. Donnelley, K. S. Morgan, K. K. W. Siu, A. Fouras, N. Farrow, R. Carnibella and D. Parsons: J. Synchrotron Rad. 21, p.768 (2014)., different animal models of CF to assess differences in treatment effect with disease, and will compare different methods of treatment delivery. None of these types of studies are possible with previous techniques used to measure the airway surface liquid.
To whom Correspondence should be addressed: kayemorgan7@gmail.com
References
[1] K. S. Morgan, M. Donnelley, N. Farrow, A. Fouras, N. Yagi, Y. Suzuki, A. Takeuchi, K. Uesugi, R. Boucher, K. Siu, D. Parsons: Am. J. Resp. Crit. Care Med. 190, p.469-472 (2014).
[2] K. S. Morgan, M. Donnelley, D. M. Paganin, A. Fouras, N. Yagi, Y. Suzuki, A. Takeuchi, K. Uesugi, R. C. Boucher, D. W. Parsons and K. K. W. Siu: PLoS ONE 8, p.e55822 (2013).
[3] M. Donnelley, K. S. Morgan, K. K. W. Siu, A. Fouras, N. Farrow, R. Carnibella and D. Parsons: J. Synchrotron Rad. 21, p.768 (2014).
[4] K. S. Morgan, D. M. Paganin and K. K. W. Siu: Opt. Express 19, p.19781-19789 (2011).
[5] K. S. Morgan, P. Modregger, S. C. Irvine, S. Rutishauser, V. A. Guzenko, M. Stampanoni, C. David: Opt. Lett. 38, p.4605-4608 (2013).
(SPring-8/SACLA Research Frontiers 2015 p.32-33 より転載)