


Volume6 No.2
Resonant X-Ray Second Harmonic Generation
aBar Ilan University, bUniversity of Nebraska, cSLAC National Accelerator Laboratory, dRIKEN SPring-8 Center, eJapan Synchrotron Radiation Research Institute, JASRI, fStanford University
- Abstract
-
The purpose at this beamtime was to observe coherent resonant second harmonic generation (SHG) in Gallium Arsenide (GaAs) around the Ga K-edge. The experiment followed a previous measurement of SHG far above resonances in diamond preformed at the SACLA x-ray free electron laser [1]. However, as opposed to the case of far above resonance SHG, the description of resonant SHG requires a full quantum model. We did not measure nonlinear second harmonic generation in GaAs during that beamtime. We could only estimate an upper limit for the magnitude of the effect.
Keywords: Nonlinear Optics, Nonlinear Spectroscopy, Ultrafast effects, X-ray Optics
Background and Purpose:
Second harmonic generation (SHG) is one of the most fundamental phenomena of nonlinear optics. It is a collective ultrafast electronic process that occurs under the extreme conditions of high electric field strength. The understanding of the SHG effect at x-ray wavelengths is the first step in the exploration of new nonlinear effects occurring on the atomic length scale. In an experiment we conducted at the SACLA, we observed the first phase-matched x-ray SHG [1]. In that work, we used a 7.3 keV pump beam at an intensity of ~1016 W/cm2 and observed second harmonic generated in a diamond crystal. The observed SHG signal was about ten times larger than the second harmonic content of the pump beam, scaled quadratically with the pulse-energy, and generated over a narrow phase-matching condition. Despite the extremely high pump intensity we did not observe any radiation damage. In that experiment, the highest pulse energy we measured was about 4.3 μJ (3.7×10⁹ photons per pulse), and the spot size at the sample was 1.5 μm FWHM. If we assume pulse duration of 20 fs, this corresponds to an intensity of 1016 W/cm2.
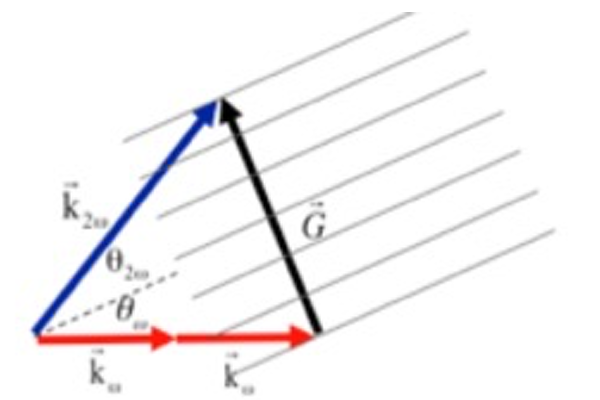
Fig. 1: phase matching diagram.
The measured maximum efficiency was about 5.8×10⁻¹¹.
Like other wave mixing effects x-ray SHG requires momentum conservation and energy conservation. The energy conservation is satisfied when the frequency of the generated photons is equal to twice the frequency of the input photon. Momentum conservation, which is usually denoted as phase matching, is satisfied when 2kω+G=k2ω, with kω and k2ω and G denoting the k-vectors of the fundamental, second harmonic, and reciprocal lattice vector. The phase matching diagram is shown in Fig. 1. Here we define θω and θ2ω as the (internal) angles between the atomic planes and the fundamental beam and the second harmonic beam respectively. Because of the finite dispersion, the angles θω and θ2ω have values that are close to, but different from the Bragg angle (at 2ω). When the pump wavelength is close to the absorption edges, the dispersion is larger, and the difference between the phase matching angle to the Bragg angle increases.
Here we made the first attempt to explore SHG in a new regime where the pump photon-energy is near absorption edges in the hard x-ray regime. This is more than a straightforward extension of our pervious experiment. Here the plasma-like model we used for the description of x-ray SHG in diamond is not valid. Instead, a full quantum model is required [2]. Nonetheless, the validity of the quantum theory of second order x-ray nonlinearities at absorption edges has never been tested.
Experimental Summary:
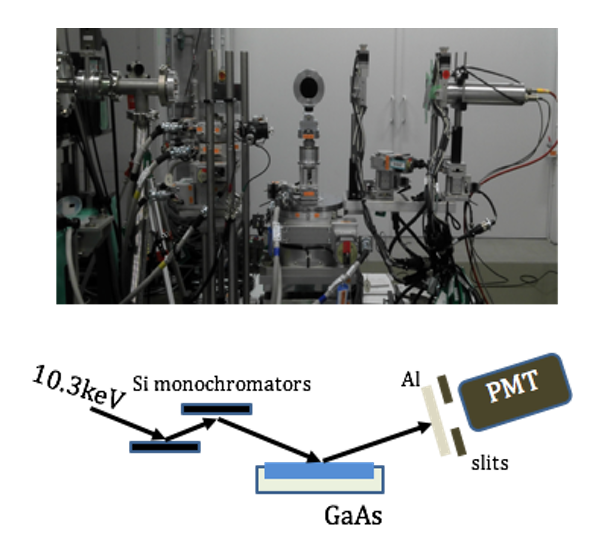
Fig. 2: Experimental setup.
Since the absorption above the K-edge is high, we chose to work in reflection geometry. Using a GaAs(111) wafer as the nonlinear medium, we planned to use the reciprocal lattice vector which is orthogonal to the (111) atomic planes in order to achieve phase matching. The experimental setup is shown in Fig. 2. The x-ray pumping beam (with average pulse energy without attenuation of about 3.5 µJ) passed through a Si(111) monochromator, Silicon (Si) and Aluminum (Al) attenuators and focused by two Kirkpatrick Baez (KB) mirrors to a 1.4 µm x 1.26 µm spot. To remain below the damage threshold without excessive attenuation of the beam, we moved the sample 20 mm off the focus, giving a 3.5 µm x 5.3 µm spot. Motorized slits and a photomultiplier (PMT) scintillation detector were mounted after the sample. In addition, Al foils were installed before the PMT to filter the fundamental photons without attenuating the pumping beam.
Results and Discussion:
Starting below the K-edge of Gallium (Ga) at photon energy of 10.35 keV, we measured rocking curves of GaAs (111), (222) and (333) reflections. Next, we measured the damage threshold by illuminating the sample with a single and with multiple pulses and compared the rocking curves of the fundamental (111) reflection before and after the illumination. A typical rocking curve of the undamaged crystal is shown in Fig. 3. The rocking curve width is about 240 µrad. In the event of considerable broadening of the rocking curve, we concluded that the illuminated spot was damaged and translated the sample enough so the next pulse would hit an undamaged region. We found considerable broadening of the rocking curve for pulse energies above 5.7 ± 1.7 µJ, which is in the order of the damage threshold expected from a model in which all the photo-absorbed energy goes to thermal melting. An example of the rocking curve, which was taken after 600 pulses, is shown in Fig. 4. The rocking curve width at a damaged spot was about 1150 µrad, which is almost 5 times wider than the rocking curve of the crystal before it was damaged. Next, we measured the rocking curve of the (111) reflection for the residual second harmonic in the beam. By varying the attenuation, which mainly filters the fundamental photons, the second harmonic count rate (one diffracted photon every 36 pump pulses at the peak of the rocking curve) in the rocking curve was hardly changed. Recalling that the efficiency of the SHG signal grows linearly with the intensity of the fundamental beam, we concluded that the diffracted second harmonic photons were originated from the second harmonic contamination in the pumping beam.
We tuned the pump photon energy to 10.365 keV, around the K-edge of Ga. We repeated the previous measurements, but we did not observe any second harmonic counts around the estimated Bragg and SHG phase matching angles. However, while expecting to observe lower damage threshold at the edge because of the increased photoelectric absorption cross-section, we did not observe significant broadening of the rocking curves.
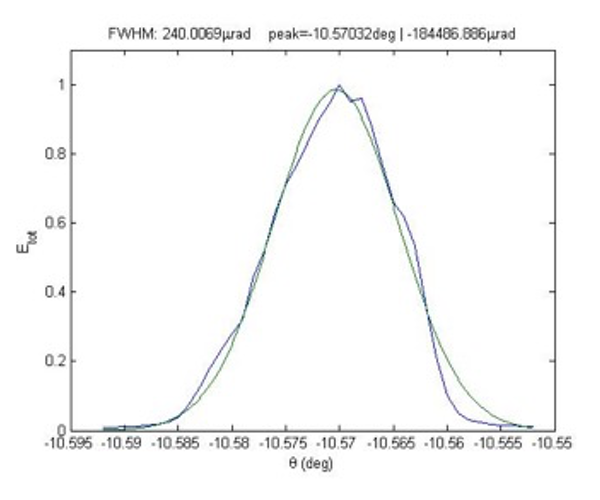
Fig. 3: Rocking curve before damage. The blue line is the measured rocking curve and the green line is the Gaussian fit we used to calculate the width of the rocking curve.

Fig. 4: Rocking curve at a damaged spot. The blue line is the measured rocking curve and the green line is the Gaussian fit we used to calculate the width of the rocking curve.
One of the major challenges of the experiment was to reduce the high residual second harmonic from the undulator, even though that intensity was only about 10-10 to compare the fundamental one. This residual second harmonic was about an order of magnitude stronger than the expected signal below the Ga edge. To reduce the second harmonics contamination in the beam, we installed an additional Si (111) double crystal channel cut between the KB mirrors and the sample. This channel cut transmitted 5% of the pump beam (therefore having average pulse energy of 0.17 µJ). The reason why such lower transmission may be angle mismatched because this filter was installed after the focusing mirrors. Therefore, we positioned the sample at the new focal point (having a 1 µm x 5 µm spot), in order to increase the intensity of the pumping beam on the sample. Repeating previous measurements, we found similar damage threshold. However, we observed only background photons at the input photon energy, and essentially no second harmonic generation was measured around the estimated Bragg and SHG phase matching angles. Examples of photon enrgy histogtams are shown in Fig. 5 (with full intensity) and in Fig. 6 (with attenuation). Unfortunately, the second harmonic photons depends linearly on the input intensity, which indicates that the measured second harmonic photons are originated from the undulator and not from the SHG process.
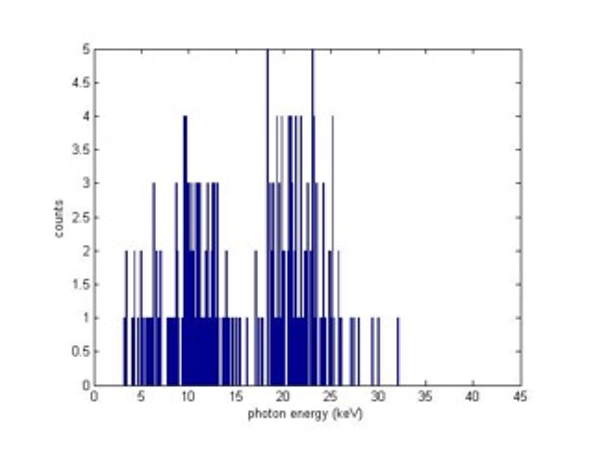
Fig. 5: Photon energy histogram with full beam. The average input pulse energy is 3.46 µJ. The number of shots is 54000.
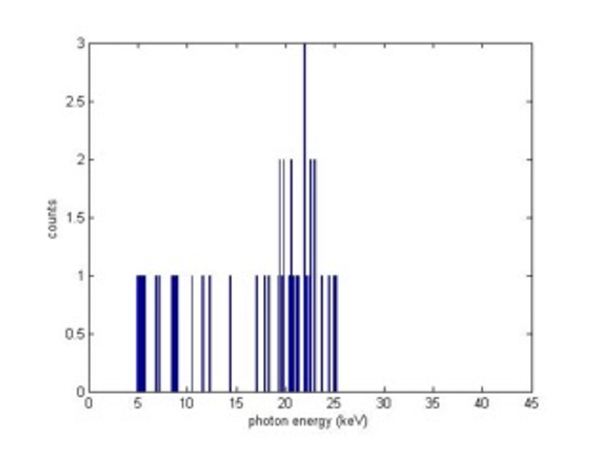
Fig. 6: Photon energy histogram with attenuation. The average input pulse energy is 0.14 µJ. The number of shots is 9000.
In summary, we did not observe second harmonic photons originated from a nonlinear process near the absorption edges. Possible explanations could be, lower peak intensities, higher absorption of the GaAs crystal, interference between the contribution of the bound and the free electrons, or induced birefringence near the absorption edge. Based on our measurements we estimate that the efficiency of the resonant SHG on GaAs near the Ga K-edge is smaller than 10-11. We found a peculiar wavelength dependence of the damage threshold that we could not explain. The threshold was higher above the resonances where the absorption was higher.
Challenges and suggestions for improvements:
The background level of the residual second harmonics from the undulator was higher than the expected results. Further suppression of noise is required. Since we work near the radiation damage threshold, a better stability of the intensity fluctuations and more adjustable spot size at the sample position can also help.
The main challenge was the residual second harmonic radiation from the undulator that was stronger than the expected SHG signal. The attempt to suppress this radiation by using a channel cut crystal before the nonlinear crystal was not successful since the channel cut crystal was mounted close to the focal plane due to the space constraints of the setup. A better place to mount the additional channel cut crystal is before the KB mirror so we propose to add this option to the beamline.
References:
[1] S. Shwartz et al., Phys. Rev. Lett. 112, 163901, (2014)
[2] I. Freund and B. F. Levine, Opt. Comm. 3, 101 (1971)
ⒸJASRI
(Received: September 19, 2017; Early edition: January 31, 2018; Accepted July 3, 2018; Published August 16, 2018)