


Volume5 No.1
SPring-8 Section A: Scientific Research Report
Study of Melt-Isothermal Crystallization Phenomenon of Crystalline Polymers by Utilizing a Simultaneous Measurement System of Synchrotron Wide-Angle and Small-Angle X-ray Scatterings and Transmission FTIR Spectra : Application to the Case of Polyoxymethylene
a Department of Future Industry-Oriented Basic Science and Materials, Toyota Technological Institute, Tempaku, Nagoya 468-8511, Japan
b Japan Synchrotron Radiation Research Institute, SPring-8, Kouto, Hyogo 679-5198, Japan
- Abstract
-
Simultaneous measurement of SAXS, WAXD and FTIR spectra has been performed to clarify the hierarchical evolution in the melt-isothermal crystallization of polyoxymethylene. The derived structural change process was found to be almost common to the various kinds of polymers, suggesting a universality of the proposed crystallization mechanism.
Keywords: Simultaneous Measurement System, Wide-angle X-ray Diffraction, Small-angle X-ray Scattering, FTIR Spectra, Isothermal Crystallization, Polyoxymethylene
Background and Purpose
In order to clarify the complicated hierarchical structural change occurring in the isothermal crystallization process of a crystalline polymer, it is useful to combine the various kinds of scattering techniques and vibrational spectroscopic methods[1-3]. The small-angle X-ray scattering (SAXS) will give us an information of the stacked lamellar structure, the wide-angle X-ray diffraction (WAXD) reveals the formation of crystalline lattice, and the infrared (and Raman) spectra tell us the regularization of random coils in the melt. All of these structural information collected as a function of time should be indispensable for getting the whole image of the structural evolution in the isothermal crystallization from the melt. Since the behavior of the crystalline polymer is quite sensitive to a slight change in the environmental condition, it is ideal to collect all of these independent data at the same time and at a high time resolution for one sample subjected to an external field. This so-called simultaneous in-situ measurement system of SAXS, WAXD and FTIR spectra was developed by us for the first time and applied to the various kinds of experiments with the purposes to clarify the structural changes in the stretching process, the melt-isothermal crystallization process and so on[1-3]. The application of this system to the study of melt-isothermal crystallization was made for trans-1,4-polyisoprene[4], aliphatic nylon[5] and isotactic polypropylene[6,7]. In the present research we have been challenged to perform the simultaneous SAXS/WAXD/FTIR spectral measurement for the clarification of the rapidly-occurring structural evolution in the melt-isothermal crystallization process of polyoxymethylene (POM, -[CH2O]n-).
Before the description of the experimental results, it may be better to review our previous studies about the crystallization of this polymer and to point out the unsolved problems. In a series of papers[8-10] we already reported the regular structural formation of POM in the isothermal crystallization process after the rapid cooling from the molten state by performing the simultaneous SAXS and WAXD measurement and also by carrying out the time-resolved FTIR spectral measurement, which was separately performed from the X-ray scattering experiment. On the basis of the thus-collected data, we derived the evolution process of the stacked lamellar structure concretely and found out the generation of the so-called taut tie chains passing through the neighboring lamellae. At that moment, however, we had many problems to be solved. The first one was that the measurement of X-ray scattering and IR spectral data must be performed simultaneously as mentioned above. The second point was a lack of structural information in an earlier stage of crystallization immediately after the temperature jump from the melt to a prefixed crystallization temperature (Tc). We need to know the mechanism how the lamellae are created from the melt. The newly-developed simultaneous measurement system combined with the sharp temperature jump cell apparatus has made it possible to study the detailed structural evolution of POM at a high time resolution and in a wide time range.
Experimental Section:
(A) Samples POM sample used here was supplied by Polyplastics Co., LTD. Japan, which was not a homopolymer but a copolymer containing a small amount of ethylene oxide comonomer to avoid the thermal degradation in the melt (the average molecular weight (Mw) 16900). The details of the sample preparation were already described in the previous papers[8-10]. Although the melting point is different from the homopolymer, the crystallization behavior itself is essentially the same as already discussed before[8-10].
(B) Setting-up of the Simultaneous Measurement System Figure 1 shows a snapshot of the simultaneous measurement system set up in the beamline 40B2 of SPring-8. The computer-controlled temperature jump cell developed by ourselves was set on the stage, around which a miniature FTIR spectrometer (Bruker alpha), the flat panel detector for WAXD data collection (Hamamatsu Photonics K.K.) and the image-intensified CCD detector for SAXS data collection (Hamamatsu Photonics K.K.) were arranged correctly. Both of X-ray beam of 1.5 Å wavelength and infrared beam were incident to the sample of about 0.05 mm thickness. The temperature of the sample was monitored using a thermocouple embedded inside. The jumping rate of temperature was about 600°C/min and the temperature fluctuation was about 0.2°C. The SAXS and WAXD data were collected at a time interval 5 seconds and the FTIR spectra at every 7 seconds.
(C) Data Treatments The 2D-SAXS and WAXD data were treated in the following ways for the quantitative analyses, the details of which will be mentioned in the next section. The 1D-SAXS and WAXD profiles or the plots of integrated intensity against the scattering vector q [= 4πsin(θ)/λ with the scattering angle 2θ] were obtained by integrating the 2D-scattering data after the background correction. The intensities of the IR crystalline bands were estimated with a commercial program (Grams, Thermo Inc.) after the baseline correction and separation of the overlapped bands.
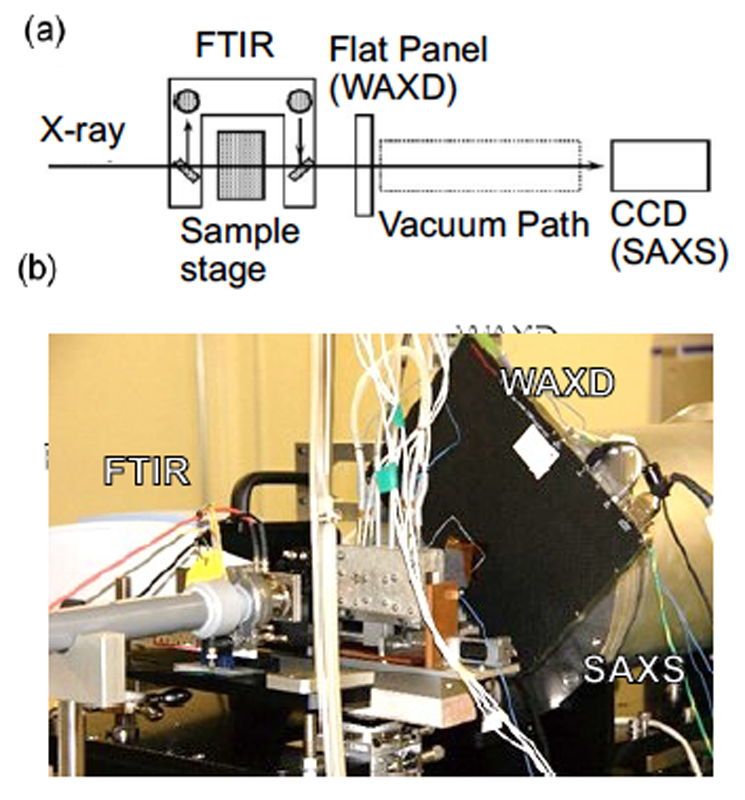
Figure 1. A snapshot of the simultaneous SAXS/WAXD/FTIR measurement system.
Results and Discussion:
(A) Time-Dependent Data Figure 2 shows the time dependence of the 1D-SAXS and WAXD profiles and FTIR spectra obtained for POM at Tc = 143°C or the degree of supercooling ΔTc (= T°m – Tc) 47°C where the equilibrium temperature T°m (= 189.5°C) was reported already in references[11,12]. In the SAXS data, the central scattering intensity was found to increase at first and then the peak of long period started to appear with increasing time. At almost the same timing the WAXD 100 diffraction peak started to increase its intensity.
(B) SAXS Data Analysis As mentioned above, it is quite difficult to extract the unique structural information from the SAXS data with the broad profiles. Then we assumed here the following 4 possible structural evolution processes for the SAXS data analysis: (stage I) the local density of the melt may fluctuate with a correlation length ζ, (stage II) in these higher density parts, the regularization of random coils may occur and they form a domain with a radius of gyration Rg, (stage III) the number of these domains is increased with time and the correlation length ξ between the neighboring domains becomes shorter, and (stage IV) finally they are combined together to form a lamella and these lamellae are stacked together at a long period LP. Sometimes the secondary crystallization occurs in the amorphous region between the adjacent lamellae, and the new lamellae are generated with the long period of LP/2[8-10]. These individual phenomena can be expressed using the theoretical equations between the scattering intensity I(q) and scattering vector q as proposed in the literatures[13,14].
(Stage I) An Ornstein-Zernike equation, I(q) ~ I(0)/(1 + ζ2q2) in the central scattering region
(Stage II) A scattering intensity equation for the domain with a radius of gyration Rg, I(q) ≈ I(0)[1-(M4/6M2)D2q2 +(M6/120M2)D4q4] in the region of q << Rg-1. Here, D is a radius of the domain sphere, Mk is the k-th moment of correlation function γ(r), ![]() where r is the distance between the two points in the electron density space. Then the Rg is given as Rg = (M4/2M2)1/2D.
where r is the distance between the two points in the electron density space. Then the Rg is given as Rg = (M4/2M2)1/2D.
(Stage III) A Debye-Buche equation with the domain correlation function of the form exp(-r/ξ), I(q) ~ I(0)/(1 + ξ2q2)2 in the q range wider than stage II, where r is the distance between the neighboring domains.
(Stage IV) Correlation function between the lamellae, K(z) = <[η(z’) - <η>] [η(z+z’) - <η>]> =![]() where η(z) is the electron density distribution of lamellae along the c axis, <η> is the mean electron density and < > is an ensemble average. The z is an interlamellar distance along the c axis.
where η(z) is the electron density distribution of lamellae along the c axis, <η> is the mean electron density and < > is an ensemble average. The z is an interlamellar distance along the c axis.
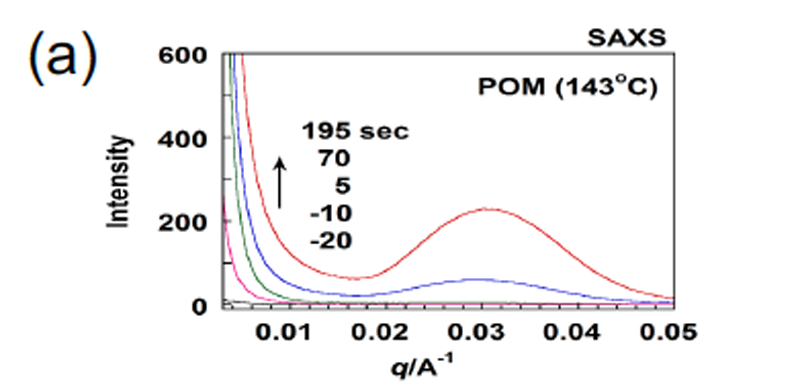
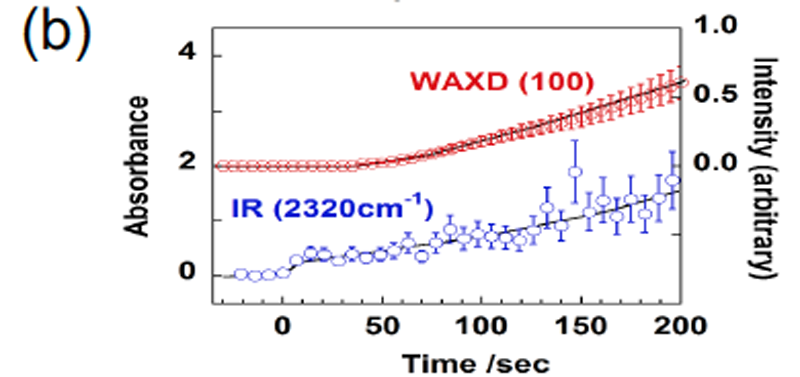
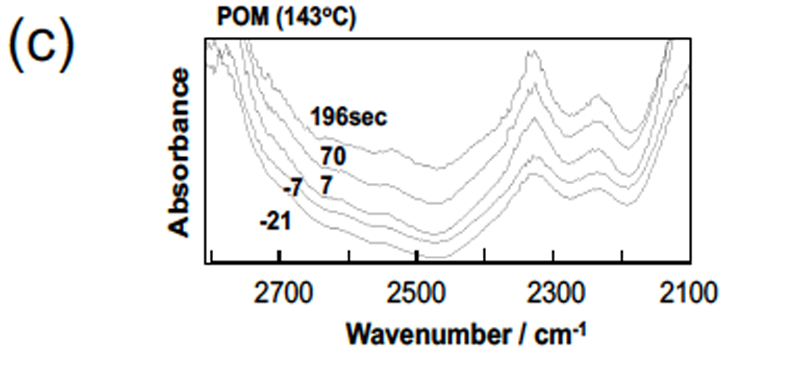
Figure 2. Time dependence of (a) 1D-SAXS profiles, (b) 1D-WAXD profiles and (c) FTIR
spectra measured for POM in the melt-isothermal crystallization process at Tc = 143°C.
The computer program has been written for these analyses in order to treat a full set of 2D- and 1D-SAXS data consisting of the several hundreds of files collected at a time interval of 7 seconds for the several tens minutes. All the corrected data were analyzed by the least-squares fittings on the basis of the abovementioned equations.
(C) Structural Evolution Figure 3 shows the time dependences of the structural parameters ζ, Rg, ξ and LP in comparison with the WAXD and FTIR data, which were obtained for POM sample at Tc = 143°C. Before the temperature jump was made (time <0), the sample was kept in the molten state. The OZ plot gave us the information of the density fluctuation in the melt or the correlation length ζ. Immediately after the temperature jump, the formation of domains was detected and the corresponding Rg was evaluated, which was found for the first time almost the same as ζ. Another correlation length ξ corresponding to the average distance between the domains, derived from the Debye-Buche equation, was found to decrease in the range between Rg and LP, indicating the gradual aggregation of these domains to form the lamellae with the long period LP. In the present experiment, the crystallization temperature was so high and the formation of the daughter lamella in the region sandwiched by the two original lamellae was not detected. In other words, the extraction of taut tie chains was not made successfully[8-10]. This is because the crystallization temperature was relatively high compared with the previously reported experiments. The FTIR data gave us the information of the formation of regular helices in the melt. The crystalline band at 2320 cm-1, for example, increased the intensity with time, and this timing corresponds to the appearance of the domains. The formation of short regular helices in the molten state occurs in the quite early stage of crystallization in the present POM case compared with the other polymer cases[15].

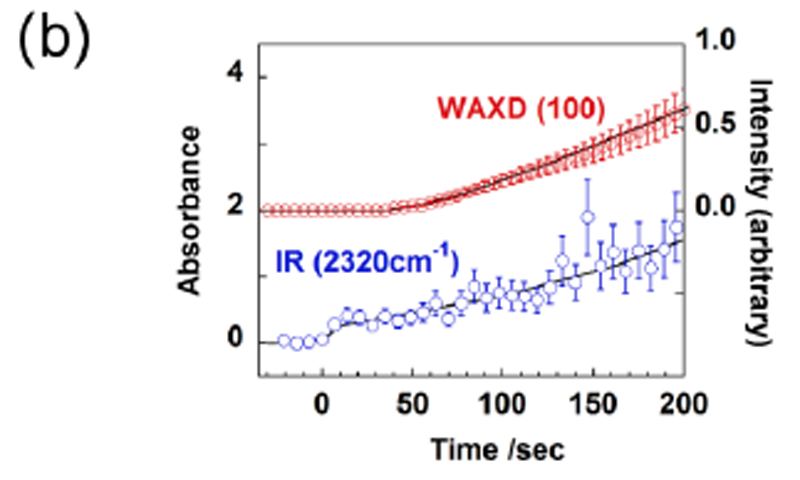
Figure 3. Comparison of time-dependent parameters obtained by (a) SAXS and
(b) WAXD and FTIR in the melt-isothermal crystallization process of POM sample.
From these experimental data, we can illustrate the regularization process of POM as shown in Figure 4: the domain formation resulting from the density fluctuation in the melt, the closer correlation of these domains and their aggregation to form the stacked lamellar structure. The thus-obtained structural evolution is essentially the same as those proposed for the various kinds of polymers[4-7].
The similar temperature jump experiments were performed at the crystallization temperature Tc of 150 - 130°C. In the experiment at 130°C, the crystallization occurred too fast to detect the structural evolution process in the early stage. As described in a separate paper[15], we performed this type of experiment also for the fully-deuterated POM sample [POM-D, -(CD2O)n-] at the same ΔTc as above, in which case the secondary crystallization of the daughter lamellae was observed clearly, suggesting the formation of taut tie chains passing through the adjacent lamellae[8-10]. The sensitive balance between the crystallization rate and the stability of the stacked lamellae might give the difference in the crystallization behavior between the isotopic species POM-H and POM-D[11,12,15].

Figure 4. Illustration of structural evolution in the melt-isothermal crystallization
process of POM sample.
Conclusion and Future Works:
The structural evolution process of POM in the melt-isothermal crystallization process has been traced successfully on the basis of the simultaneous and time-resolved measurement of SAXS, WAXD and FTIR data in the BL40B2. The derived structural evolution was found to be essentially the same as those observed for the other kinds of polymers, suggesting the universality of the structural regularization phenomenon in the melt-isothermal crystallization process of the various crystalline polymers. It is needed to interpret this universality from the theoretical point of view and/or using a computer simulation method.
References:
[1] K. Tashiro, H. Yamamoto, T. Yoshioka, T. H. Ninh, S. Shimada, T. Nakatani, H. Iwamoto, N. Ohta, H. Masunaga, KOBUNSHI-RONBUNSHU (Special issue), 69, 213-227 (2012).
[2] K. Tashiro, S. Sasaki, Progr. Polym. Sci., 28, 451 - 519 (2003).
[3] K. Tashiro, H. Yamamoto, T. Yoshioka, T. H. Ninh, M. Tasaki, S. Shimada, T. Nakatani, H. Iwamoto, N. Ohta, H. Masunaga, Macromolecules, 47, 2052 – 2061 (2014).
[4] P. J. Ratri, K. Tashiro, Polym. J., 45, 1019-1026 (2013).
[5] K. Tashiro, K. R. Reddy, A. Nishiyama, M. Hanesaka, S. Tsuji, T. Hashida, W. Y. Cao, H. Masunaga, S. Sasaki, M. Takata , KOBUNSHI-RONBUNSHU (Special issue), 66, 536-549 (2009).
[6] R. K. Reddy, K. Tashiro, T. Sakurai, N. Yamaguchi, S. Sasaki, H. Masunaga, M. Takata, Macromolecules, 42, 4191-4199 (2009).
[7] K. Tashiro, H. Yamamoto, H. Wang, N. Ohta, Polym. Prepr. Jpn., 65, 1Pc029 (2016).
[8] H. Hama, K. Tashiro, Polymer, 44, 2159 - 2168 (2003).
[9] H. Hama, K. Tashiro, Polymer, 44, 3107 - 3116 (2003).
[10] H. Hama, K. Tashiro, Polymer, 44, 6973 - 6988 (2003).
[11] S. Kummara, K. Tashiro, Polymer, 80, 138-145 (2015).
[12] S. Kummara, K. Tashiro, T. Monma, K. Horita, Macromolecules, 48, 8070-8081 (2015).
[13] A. Guinier, G. Fournet, “Small Angle X-ray Scattering”, John Wiley &Sons, Inc. (London) (1955).
[14] L. A. Feigen, D. I. Svergun, “Structure Analysis by Small-Angle X-ray and Neutron Scattering” Plenum Press (New York) (1987).
[15] S. Kummara, K. Tashiro, Polymer, 90, 76-88 (2016).
ⒸJASRI
(Received: August 25, 2016; Early edition: October 25, 2016; Accepted: December 12, 2016; Published: January 31, 2017)