


Volume4 No.2
SPring-8 Section A: Scientific Research Report
Effect of Hydrogen on the Melting Temperature of Fe–FeS System
at High Pressure
aTohoku University, bSapienza University of Rome, cCarnegie Institution of Washington, dJASRI
- Abstract
-
We have performed in situ X-ray diffraction experiments on the Fe–S–H system up to 10 GPa and 1673 K at BL04B1. The subsolidus phases were FeHx (x~0.4) and FeSHx (x~0.2) at 5 GPa and FeHx (x~0.9) and FeSHx (x~0.3) at 10 GPa. We found that H depressed the liquidus of Fe–26 wt.% S by 200–300 K whereas its solidus (i.e., eutectic temperature of the Fe–FeS system) did not decrease.
Keywords: melting temperature, metal hydride, high pressure
Background and Purpose
Iron is a primary component of planetary cores and the cores are believed to contain a small amount of light elements [e.g., 1]. It is essential to investigate the phase diagrams of the iron-light element systems at high pressure and high temperature, in order to constrain the composition and structure of the cores [e.g., 2]. Sulfur and hydrogen are major candidate elements for the light elements in the cores [e.g., 3].
The phase diagram of an Fe–FeS system has been extensively investigated at high pressures and high temperatures [e.g., 4]. Hydrogen is known to dissolve in interstitial sites of Fe and FeS lattices and to depress strongly those melting temperatures [e.g., 5, 6]. However, it is still not clear whether hydrogen affects the liquidus and eutectic temperature and composition of the Fe–FeS system. In the present study, in order to understand the melting relations in the Fe–S–H system, we have performed in situ X-ray diffraction experiments at high pressures and high temperatures.
Experimental Summary
In situ X-ray diffraction experiments were conducted using a Kawai-type 1500 ton multianvil high-pressure apparatus (SPEED-Mk.II) installed at the BL04B1 beamline [7]. A Ge solid state detector was placed at a fixed angle of 5.5° from the incident X-ray beam, and the diffracted X-rays were energy-analyzed. The incident X-ray slit size was 0.1 × 0.05 mm in the present work. SPEED-Mk.II can be oscillated at an angle from –7° to 13° during the X-ray diffraction measurements, reducing the effect of crystal grain growth on the diffraction patterns [8]. The typical oscillation angle range was from 0° to 5° in this work. The diffraction patterns were collected for a period of 60–300 s at each 50–100 K temperature step. The experimental pressures were 5 and 10 GPa at temperatures up to 1673 K.
We used an 18/11 cell assembly (18 mm octahedron edge length and 11 mm truncated edge length of tungsten carbide cubic anvils). Figure 1a is a schematic illustration of the cell assembly used in the present study. The high temperatures were generated using a cylindrical composite heater made of titanium boride and boron nitride (TiB2 + BN). The temperature was measured using a W5%Re–W26%Re thermocouple (TC) which was located above the capsule inside the heater. Experimental pressures were estimated from the lattice parameters of NaCl mixed with MgO [9]. Powder mixture of Fe (99.9+% purity, Alfa Aesar) and FeS (99.98% purity, Alfa Aesar) was used as starting materials for the Fe–13 wt.% S and Fe–26 wt.% S samples and was placed at the top of a NaCl capsule which is able to seal hydrogen effectively at high pressure and high temperature [e.g., 10]. A LiAlH4 powder was packed into the bottom of the NaCl capsule as a hydrogen source, which was separated from the Fe–FeS sample using a thin MgO disk to avoid any adverse chemical reaction (Figure 1b). Hydrogen was supplied to the sample by the thermal decomposition of LiAlH4 [11].
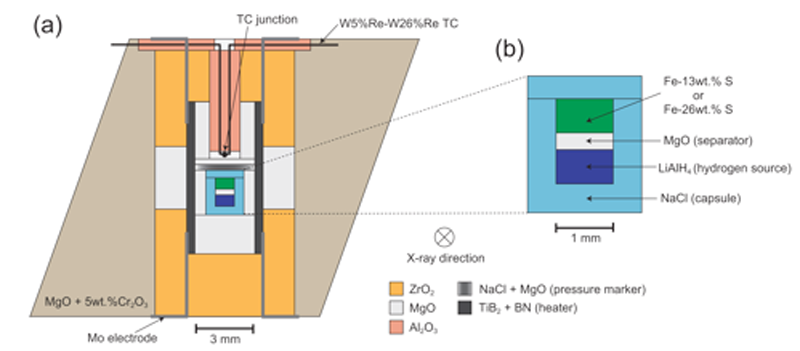
Fig. 1. Schematic illustrations of (a) the experimental 18/11 cell assembly and (b) the sample chamber.
In metal hydrides, hydrogen atoms occupy interstitial sites of metal lattices and the atomic volumes of the host metal expands. Thus, the hydrogen concentration (x) in a metal hydride, MHx, can be roughly estimated from the following expression:
x = [V(MHx)-V(M)]/VH (1)
where V(MHx), V(M), and Vx denote the atomic volumes of the metal hydride and host metal, and the volume increase per hydrogen atom, respectively [e.g., 12]. V(FeHx) and V(FeSHx) were directly measured at high pressure and high temperature by in situ X-ray diffraction experiments, and V(Fe) and V(FeS) were estimated from the previous volume data for a face-center-cubic (fcc)-Fe [13] and a NiAs-type FeS (phase V) [6, 14]. For values of VH, we follow the previous studies, i.e., 1.9 Å3 for fcc-FeHx [e.g., 15], and 2.5 Å3 at 5 GPa and 2.4 Å3 at 10 GPa for NiAs-type FeS [6].
Results and Discussion
Figure 2 shows X-ray diffraction patterns for Fe–26 wt.% S–H obtained at 10 GPa and at elevated temperatures. The diffraction lines of fcc-FeHx and NiAs-type FeSHx (phase V) were observed between 773 and 1173 K. Those of fcc-FeHx disappeared at 1233 K, accompanied by the appearance of a broad halo peak between 50 and 80 keV indicating the presence of a melt. At 1373 K, those of NiAs-type FeSHx also disappeared and the observed diffraction lines were ascribed to MgO of the separator. The partial melting temperature (solidus) for Fe–26 wt.% S–H is consistent with the eutectic temperature of the Fe–FeS system at 10 GPa [4], whereas its total melting temperature (liquidus) is lower by approximately 300 K than that of the Fe–FeS system at 10 GPa [4]. Hydrogen concentrations in FeHx and FeSHx at 5 and 10 GPa are shown in Figure 3. Both FeHx and FeSHx almost reached those solubilities of hydrogen reported by previous studies [5, 6, 15] at the temperature below the solidus. We did not observe the difference of hydrogen concentrations in FeHx and FeSHx between Fe–13 wt.% S and Fe–26 wt.% S. Based on those results, it is considered that hydrogen could depress the liquidus of the Fe–FeS system and, however, could not affect its solidus (i.e., eutectic temperature) which is consistent with the previous result [16].
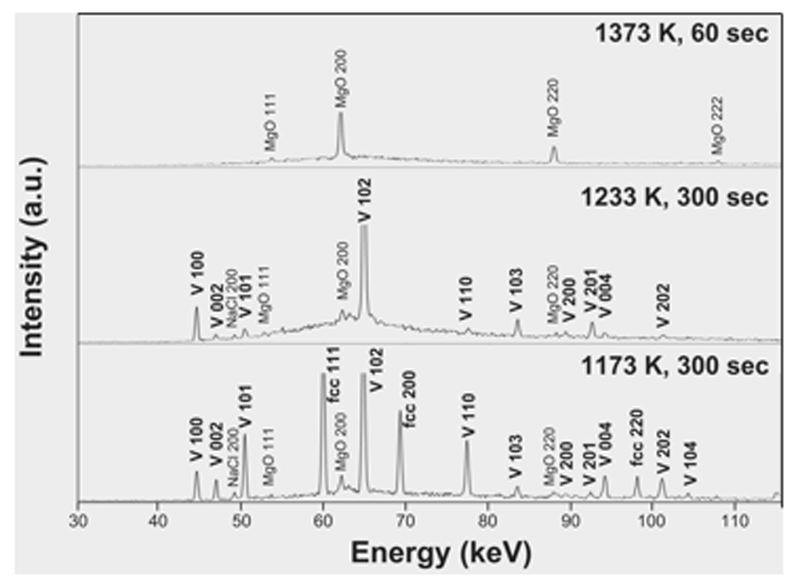
Fig. 2. X-ray diffraction patterns of Fe–26 wt.% S–H at 10 GPa. fcc: fcc-FeHx,
V: NiAs-type FeSHx (phase V)
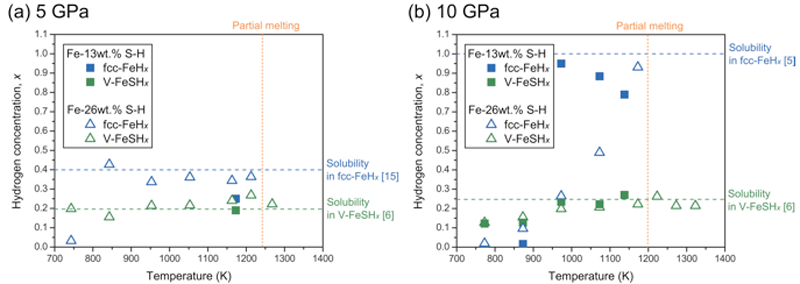
Fig. 3. Hydrogen concentrations in FeHx and FeSHx at (a) 5 GPa and (b) 10 GPa.
Based on our results combined with previous studies [6, 16, 17], Figure 4 shows the expected phase diagrams at 5 and 10 GPa assuming that FeHx and FeSHx are endmembers. Because of higher solubility of hydrogen in Fe than that in FeS, the depression of liquidus due to the hydrogen dissolution could be larger on the Fe-rich side from the eutectic composition than that on the FeS-rich side. In addition, because hydrogen does not affect the eutectic temperatures of the Fe–FeS system, the partial melting region in the FeHx–FeSHx system could be narrower than that in the Fe–FeS system.
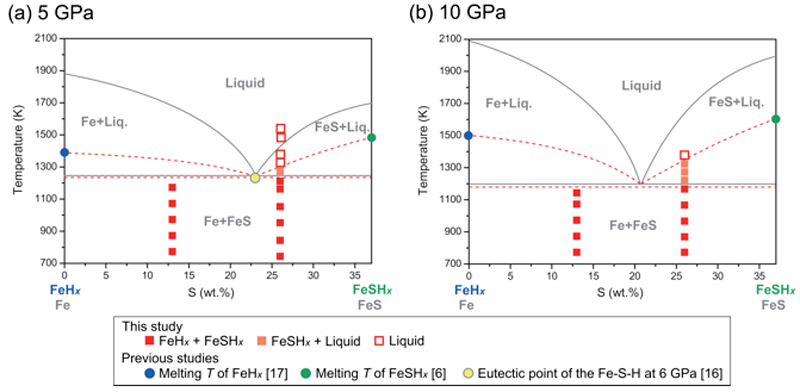
Fig. 4. Expected phase diagrams at (a) 5 and (b) 10 GPa assuming that FeHx and FeSHx are endmembers. Red dotted lines denote the expected phase boundaries of the FeHx–FeSHx system. Gray solid lines denote the phase boundaries of the Fe–FeS system reported by previous studies [4, 18].
Challenges
At the time of experiments on Fe–13 wt.% S–H, the Fe–S–H melt leaked and reacted with LiAlH4 above the solidus temperature, because the MgO separator between the sample and LiAlH4 was slightly smaller than the inner diameter of the NaCl capsule. Then, following experiments on Fe–26 wt.% S–H, we filled the space with the dried MgO powder and could succeed in observing the melting of the Fe–26 wt.% S–H system. As a next step, further experiments with various amount of sulfur will be carried out in order to determine the phase relations of the Fe–S–H system more precisely.
Acknowledgements
The authors thank K. Nishida, M. Sakurai and M. Ushioda for their technical support. Y. Shibazaki was supported by JSPS Postdoctoral Fellowships for Research Abroad.
References
[1] F. Birch, J. Geophys. Res. 57, 227 (1952).
[2] J. Li, Y. Fei, The Mantle and Core, Treatise on Geochemistry, second ed., R. W. Carlson, ed., Elsevior, 3, 527 (2014).
[3] J. -P. Poirier, Phys. Earth Planet. Inter. 85, 319 (1994).
[4] Y. Fei, C. M. Bertka, L. W. Finger, Science 275, 1621 (1997).
[5] K. Sakamaki, E. Takahashi, Y. Nakajima, Y. Nishihara, K. Funakoshi, T. Suzuki, Y. Fukai, Phys. Earth Planet. Inter. 174, 192 (2009).
[6] Y. Shibazaki, E. Ohtani, H. Terasaki, R. Tateyama, T. Sakamaki, T. Tsuchiya, K. Funakoshi, Earth Planet. Sci. Lett. 301, 153 (2011).
[7] W. Utsumi, K. Funakoshi, S. Urakawa, M. Yamakata, K. Tsuji, H. Konishi, O. Shimomura, Rev. High Press. Sci. Technol. 7, 1484 (1998).
[8] T. Katsura, K. Funakoshi, A. Kubo, N. Nishiyama, Y. Tange, Y. Sueda, T. Kubo, W. Utsumi, Phys. Earth Planet. Inter. 143-144, 497 (2004).
[9] D. L. Decker, J. Appl. Phys. 42, 3239 (1971).
[10] Y. Fukai, T. Haraguchi, E. Hayashi, Y. Ishii, Y. Kurokawa, J. Yanagawa, Defect Diffusion Forum 194-199, 1063 (2001).
[11] J. R. Ares, K. -F. Aguey-Zinsou, M. Porcu, J. M. Sykes, M. Dornheim, T. Klassen, R. Bormann, Mater. Res. Bull. 43, 1263 (2008).
[12] Y. Fukai, High-Pressure Research: Application to Earth and Planetary Sciences, Y. Syono, M. H. Manghnani, ed., TERRAPUB, 373 (1992).
[13] N. Tsujino, Y. Nishihara, Y. Nakajima, E. Takahashi, K. Funakoshi, Y. Higo, Earth Planet. Sci. Lett. 375, 244 (2013).
[14] S. Urakawa, K. Someya, H. Terasaki, T. Katsura, S. Yokoshi, K. Funakoshi, W. Utsumi, Y. Katayama, Y. Sueda, T. Irifune, Phys. Earth Planet. Inter. 143-144, 469 (2004).
[15] T. Hiroi, Y. Fukai, K. Mori, J. Alloys Comp. 404-406, 252 (2005).
[16] A. S. Buono, D. Walker, Meteorit. Planet. Sci. 50, 547-554 (2014).
[17] Y. Fukai, K. Mori, H. Shinomiya, J. Alloys. Compd. 348, 105 (2003).
[18] R. Brett, P. M. Bell, Earth Planet. Sci. Lett. 6, 479 (1969).
ⒸJASRI
(Received: March 19, 2016; Early edition: May 25, 2016; Accepted: June 24, 2016; Published: July 25, 2016)