


Volume4 No.1
SPring-8 Section A: Scientific Research Report
Soft Phonon in an Antiferromagnetic and Ferroelectric Sr0.5Ba0.5Mn0.97Ti0.03O3
aRIKEN CMSE, bSPring-8/JAEA, cRIKEN SPring-8, dSPring-8/JASRI, eUniv. Tokyo
- Abstract
-
Phonon dynamics of multiferroic Sr0.5Ba0.5Mn0.97Ti0.03O3 was investigated by means of inelastic x-rays cattering. We found that the mode which corresponds to the soft mode in the paraelectric materials becomes prominent below the antiferromagnetic phase transition temperature. On the other hand, the energies of transverse optical phonon modes remain almost constant upon the magnetic ordering. This suggests that dynamical fluctuation of electric dipole moments is crucial for a large spin-phonon coupling.
Keywords: inelastic x-ray scattering, multiferroics, phonon dynamics
Background and Purpose
Multiferroics, where magnetic ordering and ferroelectric polarization coexist, can be categorized intoseveral classes based on the mechanism. One of well-known mechanisms is spin-driven ferroelectricity [1,2]. When cycloidal spin structure is realized, the anions located in the middle of the two magnetic ions shift tothe off-center position due to the spin current or inverse Dzyaloshinskii-Moriya mechanism. The prototypical multiferroic in this class is perovskite TbMnO3. In this mechanism, the ferroelectricity emerges as a result of magnetic ordering, and thus coupling between the magnetism and ferroelectricity is inevitably strong. However, the magnitude of the electric polarization observed in this class of material is typically small as compared with proper ferroelectrics, such as perovskite BaTiO3. Another well-known multiferroic is perovskite BiFeO3[3], where the 6s lone pair of Bi ion is responsible for ferroelectricity and localized magnetic moment of Fe ion is responsible for the magnetism. Electric polarization of BiFeO3 is large, but the coupling between magnetism and ferroelectricity is small, because the magnetism and ferroelectricity are governed by different ions.
Perovskite Sr1-xBaxMnO3 is a multiferroic material which has different origin from the mechanisms mentioned above [4]. The pristine SrMnO3 is paraelectric with large dielectric constant at low temperatures. Upon doping the larger Ba ion into the Sr site, the ferroelectric instability increases, resulting in an increaseof dielectric constant. Phonon mode softening is also observed with increasing x by optical reflectivity and inelastic x-ray scattering measurements. Increasing x ≥ 0.45 causes the system to become ferroelectric with off-center displacement of magnetic Mn4+ ions. The electric polarization of Sr0.5Ba0.5MnO3 is 13.5 μC/cm2 at 2 K, which is comparable with a proper ferroelectric material BaTiO3. Sr0.5Ba0.5MnO3 orders antiferromagnetically below TN = 185 K. At that temperature, the magnitude of the lattice distortion which reflects the electric polarization changes by 70 %, which indicates the strong coupling between magnetism and ferroelectricity of the system, as expected from the fact that the Mn4+ governs both ferroelectricity and magnetism. In order to clarify the coupling between magnetism and phonon dynamics, we measured inelastic x-ray spectra of the ferroelectric perovskite manganite.
Experimental Summary
A single crystal of Sr0.5Ba0.5Mn0.97Ti0.03O3 was grown by a two-step procedure as described in Ref. [4]. The properties of magnetism and ferroelectricity of Sr0.5Ba0.5Mn0.97Ti0.03O3 are qualitatively the same as those of Sr0.5Ba0.5MnO3. We observed electric polarization value of 8.7 μC/cm2 at 2 K and ferroelectric transition temperature is 400 K. Antiferromagnetic transition was observed to take place at 188 K. Inelasticx-ray scattering measurements were performed at BL35XU [5]. A silicon (11 11 11) backscattering monochrometer was used. The crystal was mounted with <001> pseudo-cubic axis horizontal and <110> axis vertical, so that we could access the reciprocal space Q = (005) + (qq0) [6]. In this setting, the scattered intensity from the phonon modes polarized parallel to the <001> axis can be detected.
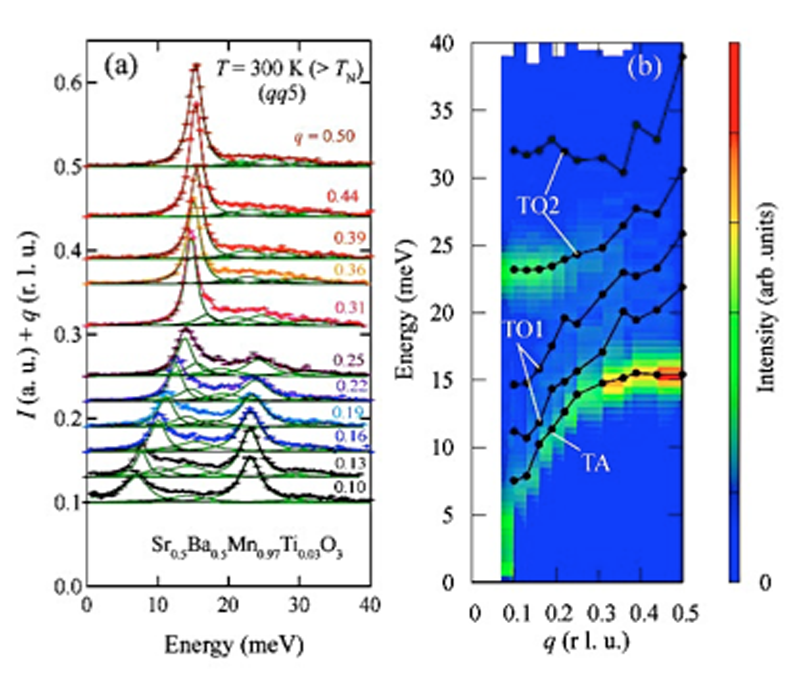
Fig. 1. (a) Inelastic x-ray scattering spectra for Sr0.5Ba0.5Mn0.97Ti0.03O3 at 300 K at the wave vector of (qq5). The solid circles correspond to the measured data, where the peak due to the elastic scattering is subtracted by fitting the resolution function to the pseudo-Voigt function. The solid lines denote the fitting results based on the damped harmonic oscillator model [Eq. (1)], and the green lines are the individual damped harmonic oscillator peaks. (b) Color plot of the intensity in the energy- wave vector plane. The solid circles are the oscillator energies obtained by fitting the spectra to Eq. (1)
Results and Discussion
Fig. 1 shows the inelastic x-ray scattering spectra at 300 K. Elastic scattering was removed by using the instrumental resolution function, and the intensity is divided by the Bose factor [n(ω)+1] . The spectrum at q = 0.10 has two distinct features at E = 7 and 23 meV. These peak structures are also observed in the paraelectric phase of Sr1-xBaxMnO3 (x ≤0.3), where lower and higher energy peak are assigned to transverse acoustic (TA) and optical (TO2) modes, respectively [7].
In addition, a broad feature is observed in between. The feature corresponds to another optical (TO1) mode, which exhibits softening in the paraelectric phase. Three modes are discernible in this energy range for the paraelectric Sr1-xBaxMnO3. Considering the lower lattice symmetry of the tetragonal ferroelectric material (as compared to the cubic paraelectric) we fit the obtained spectrum to five phonon modes modeled as damped harmonic oscillators, whose intensity is [8]:
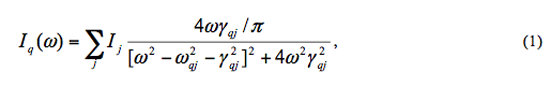
where q is the wave vector, ω is the energy transfer, ωqj and γqj are the frequency and linewidth of the jth mode with intensity Ij. We were not able to fit all the parameters simultaneously, and therefore, we first varied Ij and ωqj, and then changed γqj, separately. This fitting reproduces the observed spectra well as shown in Fig. 1(a). The lowest energy peak is assigned to the TA mode, next lower two modes are to TO1 modes, and other modes are to TO2 modes. With increasing q, the intensity of the (Bose normalized) peak originating of the TA mode increases and it disperses to higher energy. The TO2 peak is less pronounced and merges with the TO1 modes in the high q region. The mode energies, ωqj, obtained by fitting are shown as a function of q in Fig. 1(b).
The temperature dependence of the spectra at fixed q = 0.10 and 0.39 is shown in Figs. 2(a) and 2(b), respectively. Below TN = 188 K where the tetragonal distortion decreases drastically [4], one of the TO1 modes becomes prominent, resulting in the shoulder structure of lowest energy peak at q = 0.10 and distinct peak at q = 0.39 (arrows inthe figures). We have performed the two-step fitting with the 5-mode damped harmonic oscillator model, and it reproduces the spectra well in the entire temperature range, as shown by the solid lines in the figures. The intensity, energy, and the linewidth of the TO1 modes obtained by this fitting based on Eq. (1) are shown as a function of temperature in Fig. 3. The intensity ofthe lower TO1 mode increases below TN, as shown in Fig. 3(a), implying the coupling between the phonon and magnetic ordering in the system. This observation is in accord with general cases of magnetic ordering where a tiny structural distortion occurs simultaneously, and indeed a drastic change of lattice distortion was observed in this system [4]. As shown in Fig. 3(c), the linewidth of the TO1 mode at q = 0.39 decreases, as in the case of the paraelectric Sr1-xBaxMnO3 with x = 0.3 [7]. However, in the case of x = 0.3 material, the reduction in the linewidth in the magnetically ordered state becomes more significant as q vector becomes smaller, and this is apparently not the case in the present result.
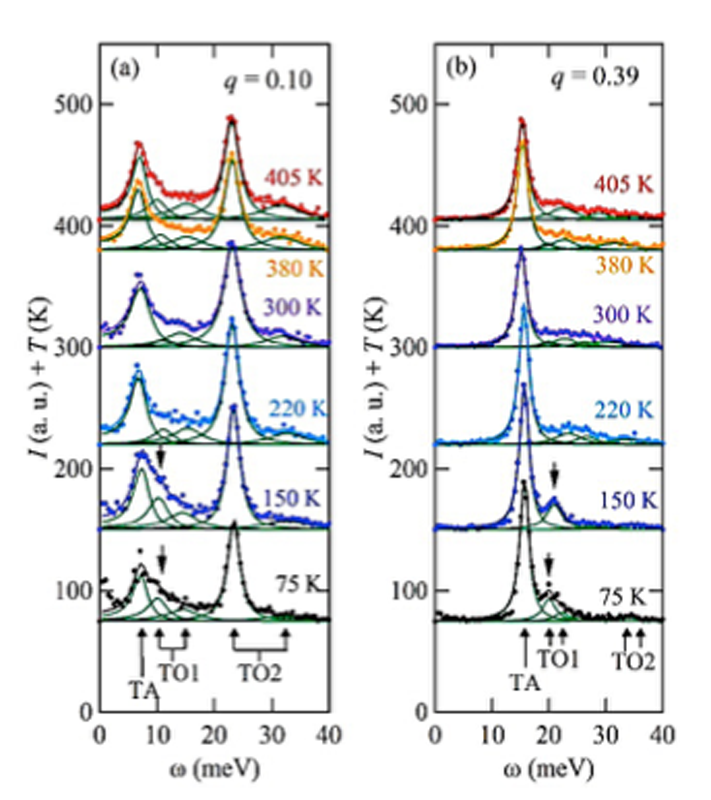
Fig. 2. Temperature dependence of the inelastic x-ray scattering spectra at (a) q = 0.10 and (b) q = 0.39.
The change in the energy of the damped harmonic oscillator upon magnetic ordering is barely visible, as shown in Fig. 3(b). This is in contrast to the results of the paraelectric Sr1-xBaxMnO3 materials, where hardening of the TO1 phonon mode is clearly observed upon magnetic ordering [7]. The hardening in the paraelectric materials can be described by a spin-phonon coupling model:
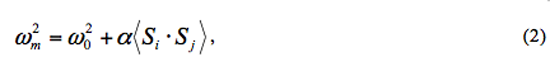
where ωm (ω0) is an energy of the phonon mode with (without) spins, α is a coupling constant, and <Si ∙ Sj> is a nearest-neighbor spin pair correlation function. Within this model, the magnitude of α in the present ferroelectric Sr1-xBaxMn0.97Ti0.03O3 is smaller than those of paraelectric materials with x ≤ 0.3. This suggests that the dynamical fluctuation of electric dipole is needed for larger α [9], and this type of spin-phonon coupling is rather reduced once long-range ferroelectric order is established. For more detailed discussion, quantitative comparison with the appropriate the oretical model is indispensable.
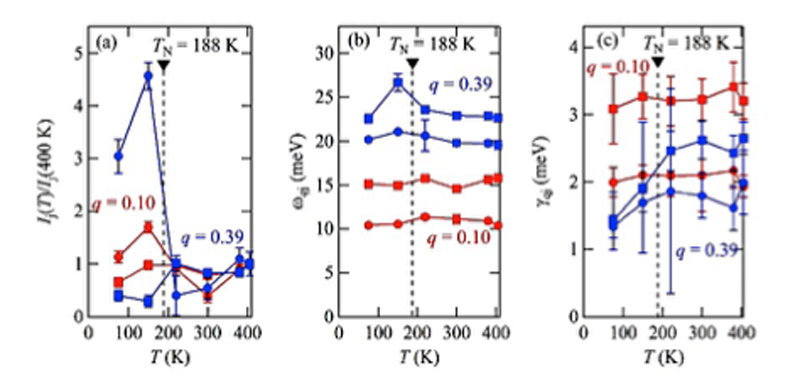
Fig. 3. Temperature dependence of (a) intensity, (b) energy, and (c) linewidth assigned to the two transverse optical (TO1) modes as obtained by fitting based on Eq. (1). The values at two different q (q = 0.10 and 0.39) are shown. The values of the TA and TO2 modes are not displayed.
Acknowledgements
The authors are grateful to H. Sakai for fruitful discussion. This work was partly supported by Funding Program for World-Leading Innovative R&D on Science and Technology on “Quantum Science on Strong Correlation” from the Japan Society for the Promotion of Science (JSPS).
References
[1] S. –W. Cheong and M. Mostovoy, Nat. Mater. 6, 13 (2007)
[2] Y. Tokura and S. Seki, Adv. Mater. 22, 1554 (2010)
[3] G. Catalan and J. F. Scott, Adv. Mater. 21, 2463 (2009)
[4] H. Sakai et al., Phys. Rev. Lett. 107, 137601 (2011)
[5] A. Q. R. Baron et al., J. Phys. Chem. Solids 61, 461 (2000)
[6] A. Q. R. Baron et al., J. Phys. Chem. 69, 3100 (2008)
[7] H. Sakai et al., Phys. Rev. B 86, 104407 (2012)
[8] B. Fåk and B. Dorner, Physica B 234-236, 1107 (1997)
[9] T. Katsufuji and H. Takagi, Phys. Rev. B 64, 054415 (2001)
ⒸJASRI
(Received: July 4, 2015; Early edition: September 25, 2015; Accepted: December 11, 2015; Published: January 25, 2016)