


Volume4 No.1
SPring-8 Section A: Scientific Research Report
Density and Thermoelastic Properties of Liquid Fe-FeO at High Pressure
aOsaka University, bOkayama University, cTohoku University, dThe University of Tokyo, eJAEA
- Abstract
-
We have measured the density of liquid Fe98.3O1.7 in the P-T range of 1.4 - 6.1 GPa and 1950 - 2250 K using X-ray absorption method at BL22XU. Microprobe analysis of the recovered samples showed the reaction between the sample and BN spacer. After removing the BN contribution to the sample density, the estimated densities of liquid Fe-O increase from 6.71 to 7.08 g/cm3 with pressure at 2200 K.
Keywords: density, liquid Fe alloy, high pressure
Background and Purpose
The Earth’s outer core is reported to be composed of liquid iron alloys with 10% of light elements, such as S, Si, C, H and O [1]. Since oxygen is one of the most abundant light elements in the Earth and enough amount of oxygen can dissolve at the core-mantle boundary condition to explain the density deficit of the outer core [2], oxygen is considered to be a major candidate of the light element in the outer core (e.g.[3]). The densities of liquid Fe-S, Fe-Si, and Fe-C have been studied at high pressure to estimate the effect of light elements on the density of liquid Fe and to apply to the composition of the outer core (e.g. [4], [5],[6]). It was revealed that the density depression and the bulk modulus are quite different depending on the variety of dissolving element.
Hence, it is important to understand the effects of individual elements on the density and elastic property of liquid iron. However the effect of oxygen on the density of liquid Fe has not been investigated due to high liquid us temperature of the Fe-O system. In this study, we have measured the density of liquid Fe-O up to 6.1 GPa and 2250 K using X-ray absorption method and estimated the thermoelastic properties of liquid Fe-O.
Experimental Summary
High-pressure and high-temperature experiments were conducted using a 180 ton DIA-type cubic anvil press (SMAP-180). The truncated edge length of the tungsten carbide (WC) anvil was 4 mm. We used monochromatic X-ray beam tuned to 35 keV, which was optimized for the best X-ray absorption contrast between the sample and surrounding materials. The incident X-ray beam was collimated to a size of 50 × 50 μm by a pair of slits. The intensities of the incident X-ray (I0) and transmitted X-ray (I) were measured using two ion chambers located in front of and behind the press, respectively.
The starting material was Fe-0.5 wt% (1.7 at%) O. This composition corresponds to the eutectic composition in the Fe-FeO system at 3 GPa [7]. The cross-section of the cell assembly in this study is shown in Fig. 1. The initially powdered sample was enclosed in a cylindrical single-crystal alumina (Al2O3) capsule with sintered alumina lids. The alumina capsule is deformable in the present experimental conditions. A cylindrical graphite heater was used. A pressure marker was a powder mixture of BN and MgO. The X-ray diffractions from the sample and the pressure marker were collected on an imaging plate detector. Experimental temperature and pressure were estimated using both W97%Re3%-W75%Re25% thermocouple and two equations of state of the pressure marker [8][9].
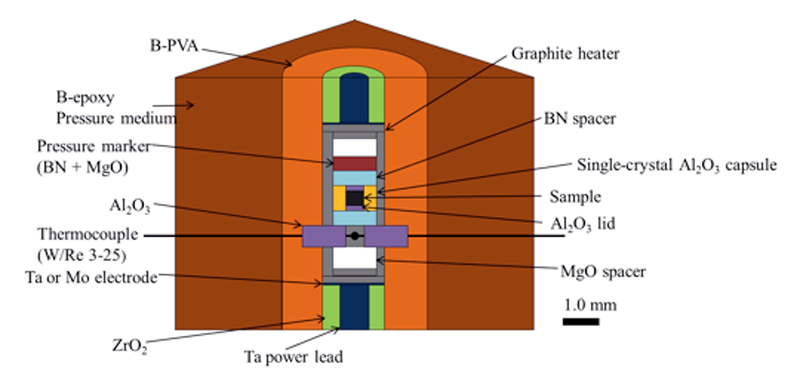
Fig. 1. A schematic picture of the cell assembly.
We measured the X-ray absorption profile (I/I0) along the radial direction of the sample by moving the press stage in 10 μm intervals. The degree of melting of the sample at each temperature was checked based on XRD patterns of the sample and intensity change of the absorption profiles. Fig. 2 shows the measured absorption profile consisted of absorption by the sample and surrounding materials. Density of the sample was obtained using X-ray absorption profile combined with the Beer-Lambert law as shown in equation (1) [10],
where μ is the mass absorption coefficient, ρ is the density, and t is the thickness of the sample in X-ray direction. Subscriptions of s, c, and e represent sample, capsule, and environment, respectively. The density of the sample was calculated by fitting the absorption profile of the sample to equation (1). The mass absorption coefficient of the sample (μs) was experimentally calibrated with the density of the crystalline sample at 300 K.

Fig. 2. X-ray absorption profile at 1.4 GPa and 2200 K. The open circles denote the observed I/I0 values. C represents a correction factor for difference in detectability of two ion chambers. The red curve is the regression curve fitting to blue circles using the equation (1).
The recovered samples were polished to observe its quench texture and to analyze chemical composition using an electron microprobe (JEOL, JXA-8230) with wavelength-dispersive spectroscopic (WDS) method at Okayama University. The microprobe analyses were operated at an accelerating voltage of 15 kV and beam currents of 20 nA. We used an electron beam with diameters of 1-2 μm.
Results and Discussion
The density of liquid Fe-O was measured up to 6.1 GPa and 2250 K. Melting of the sample was confirmed based on disappearance of the sample diffraction peaks and appearance of diffuse scattering. The melting was also identified from intensity change of the absorption profiles of the sample.
The back-scattered electron image (BSE) of the recovered sample is shown in Fig. 3. The recovered sample consisted of Fe-O, Fe-B-N-O, and BN phases. BN blobs with diameter of about 4 μm and Fe-B-N-O dendrite (B ~ 1.0 wt% and N ~1.4 wt%) were observed in the Fe-O phase. This implies that the Fe-O sample partly reacted with BN spacers. As shown in Fig. 1, the BN spacer does not directly contact with the sample. However, we observed that the liquid Fe-O sample leaked through the boundary between Al2O3 capsule and lid and contacted with BN spacer in the recovered sample (Fig. 3a). Thus, after melting of the sample, the liquid sample leaked and reacted with BN spacer, at least, at 2200 K. We could not estimate the exact temperature condition that the liquid started to react with BN.
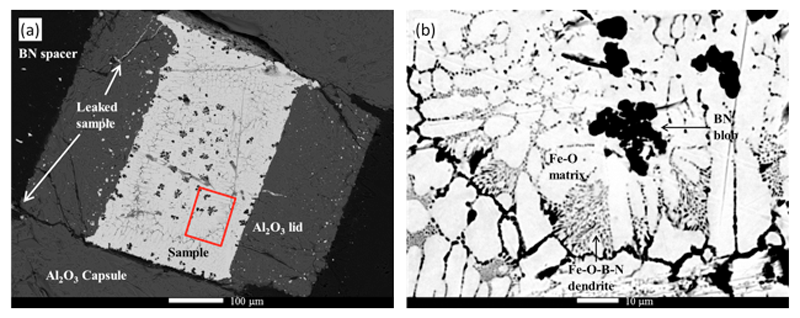
Fig. 3. The back-scattered electron image of the recovered sample. (a) Image of entire part of the sample. (b) Close-up view of the rectangular region outlined in (a).
The obtained densities of liquid Fe-O are plotted as a function of pressure in Fig. 4 (labeled as "Liquid Fe-O (+ BN)") at 2200 K. For reference, we also plotted reported compression curve of liquid Fe [11]. It is revealed that the compression curve of Fe-O (+ BN) is almost parallel to that of Fe and the density of liquid Fe-O is clearly smaller (approximately 4.3% at 6.1 GPa) than that of pure liquid Fe.
We roughly estimated the density of liquid Fe-O (labeled as corrected liquid Fe-O in Fig. 4) by subtracting BN amount from the measured density of Fe-O (+ BN). The BN concentration up to 3.6 vol% in the sample was obtained based on area analysis using BSE image (Fig. 3). The effect of BN on the density of liquid Fe-O is estimated to be approximately 2%. The densities of liquid Fe-O increase from 6.71 to 7.08 g/cm3 with pressure at 2200 K.
In order to obtain the isothermal bulk modulus of liquid Fe-O, the corrected densities of the sample were fitted with the Vinet universal equation of state [12]. The isothermal bulk modulus (K0, 2200K) were estimated to be 71 ± 8 GPa for K´ (= dK/dP) = 4 to 60 ± 9 GPa for K´ = 7. Compared to the K0, 2200K of liquid Fe [12] at the same condition, the K0, 2200K of liquid Fe-O is about 9.6% smaller assuming K´ = 5.8 [11], suggesting that liquid Fe-O is more compressible than that of liquid Fe at the present conditions.
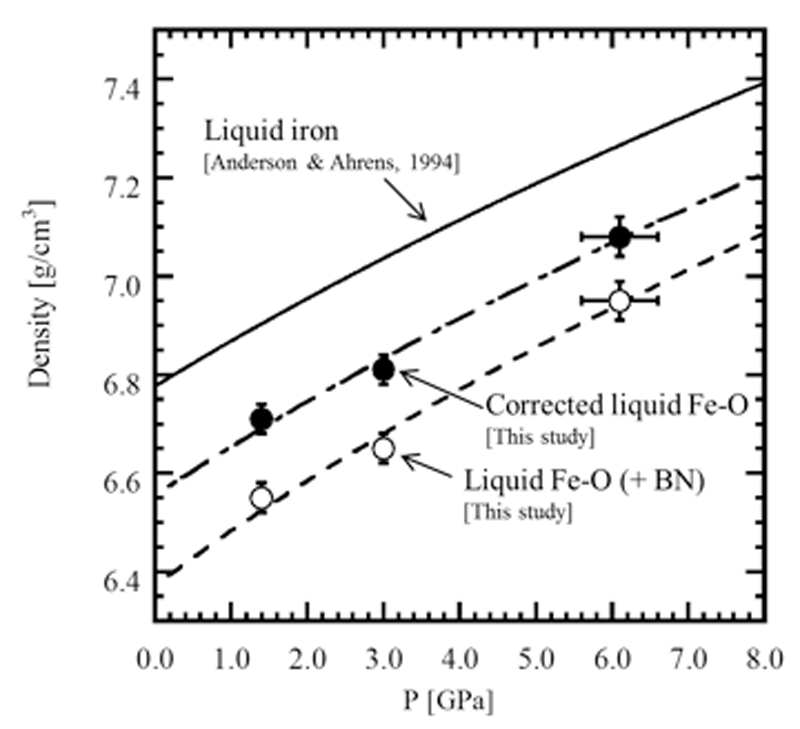
Fig. 4. Pressure dependence on the density of Fe-O at 2200 K. The open and solid circles denote the measured density of liquid Fe-O (+ BN) and the corrected density of liquid Fe-O, respectively. The dashed, dashed dotted and solid curves denote the compression curves of liquid Fe-O (+ BN), corrected liquid Fe-O, and liquid Fe (Anderson & Ahrens, 1994 [11]) fitted using the Vinet universal equation of state, respectively.
Challenges
This study shows that the density reduction of liquid Fe caused by oxygen dissolution is estimated at least 3%. The chemical reaction between leaked sample and BN spacer is possibly avoided by using MgO spacer instead of BN and by carrying out the fast XRD measurement with the flat panel detector before leaking.
Acknowledgements
The authors acknowledge R. Kamuro and S. Kishimoto for technical assistance and T. Sakaiya for constructive discussions. This work was partly supported by Grants-in-Aid for scientific research from the Ministry of Education, Culture, Sports, Science and Technology of the Japanese Government to H.T. (no.23340159). This work was also supported by a Grant-in-Aid for JSPS Fellows to Y.T. (no. 26・1795).
References
[1] J. P. Poirier, Phys. Earth Planet Inter., 85, 319-337 (1994).
[2] D. J. Frost, Y. Asahara, D. C. Rubie, N. Miyajima, L. S. Dubrovinsky, C. Holzapfel, E. Ohtani, M. Miyahara, T. Sakai, J. Geophys. Res., 115, B02202 (2010).
[3] A. E. Ringwood, Geochemi. Jour., 11, 111-135 (1977).
[4] K. Nishida, E. Ohtani, S. Urakawa, A. Suzuki, T. Sakamaki, H. Terasaki, Y. Katayama, Am. Mineral, 96, 864-868 (2011).
[5] C. Sanloup, G. Fiquiet, E. Gregoryanz, G. Morard, M. Mezouar, Geophys.Res. Let., 31, L07604 (2004).
[6] Y. Shimoyama, H. Terasaki, E. Ohtani, S. Urakawa, Y. Takubo, K. Nishida, A. Suzuki, Y. Katayama, Phys. Earth Planet Int., 224, 77-82 (2013).
[7] E. Ohtani, A. E. Ringwood, W. Hibberson, Earth Planet Sci. Let., 71, 94-103 (1984).
[8] S. Urakawa, M. Morishima, T. Kato, A. Suzuki, O. Shimomura, Photon factory Activity Report G, 275, 383 (1993).
[9] J. C. Jamieson J. N. Fritz, M. H. Manghnani, High Pressure Research in Geophysics, S. Akimoto, M. H. Manghnani, eds., Center for Academic Publications, Tokyo., (1982), 27-48.
[10] Y. Katayama, K. Tsuji, J. -Q. Chen, N. Koyama, T. Kikegawa, K. Yaoita, O. Shimomura, J. Non-Cry. Solids, 156-158, 687-690 (1993).
[11] W. W. Anderson, T. J. Ahrens, Rev. Geophys, 99, 4273-4284 (1994).
[12] P. Vinet, J. H. Rose, J. Ferrante, J. R. Smith, J. Phys.: Condens. Matter, 1, 1941-1963 (1989).
ⒸJASRI
(Received: March 3, 2015; Early edition: November 30, 2015; Accepted: December 11, 2015; Published: January 25, 2016)