


Volume3 No.2
SPring-8 Section A: Scientific Research Report
Precise Measurement of Acoustic Phonons in PrFeAsO1-y
aJapan Atomic Energy Agency, Sayo, Hyogo, 679-5148 Japan,
bRIKEN, Sayo, Hyogo 679-5148 Japan,
cJapan Synchrotron Radiation Research Institute, Sayo, Hyogo, 679-5198 Japan,
dJapan Atomic Energy Agency, Kashiwa, Chiba, 277-0871 Japan,
eJapan Atomic Energy Agency, Naka, Ibaraki, 319-1195 Japan
- Abstract
-
We investigated acoustic phonons of PrFeAsO1-y precisely to select between two different models: the in-plane soft and clipped. These predict different contamination of the longitudinal phonon by transverse one. We could reduce the contamination with improved Q resolution, but the data quality was insufficient.Based on Q dependence slightly better agreement was found with the in-plane soft model.
Keywords: iron-based superconductor, inelastic x-ray scattering, acoustic phonon
Background and Purpose
Since the discovery of superconductivity in LaFeAs(O,F) at 26 K in 2008 [1], iron-arsenides and related compounds have been one of the main subject in condensed matter physics. These compounds have a layered structure consisting of iron and arsenide/charcogenide atoms (Fe-As layer). Doping carriers into the layers or application of external and/or chemical pressure causes superconductivity at low temperature.Many studies both experimental [2-4] and theoretical [6,7], suggest the height of arsenide atoms above the center of layers is a key parameter of physical properties including superconductivity of these materials.This means that crystal structure and the lattice dynamics (phonons) related to the Fe-As layer are crucial to understand the physics of iron-based superconductors.
We have measured phonon dispersions systematically in a typical series of compounds PrFeAsO1-y and proposed two models to explain the differences at ~35 meV energy transfer optical phonon mode near Brillouin zone center between experimental data and first principles calculations [8,9]. One is an in-plane soft model (Fig. 1(a)). This model is based on non-magnetic tetragonal calculation, and the in-plane correlations between iron and arsenide atoms in Fe-As layers are softened by ~20% to lower the in-plane optical phonon energy to meet the experimental value. The other is a clipped model (Fig. 1(b)). This model is based on magnetic calculation, and the correlation between antiferromagnetically ordered iron atoms are clipped to soften only the in-plane optical phonon branch with iron atomic motions along antiferromagnetic direction.
To determine which is a better model is important, because it is related to not only the effect of magnetism in this compound but also the anisotropy in Fe-As layer, which are the recent main topics of iron-based superconductors [10-15]. We focused on transverse acoustic (TA) phonons, because the clipped model shows intensity while the in-plane soft model predicts no scattering at Q=(H,0,0) (Fig. 1).
Experimental Summary
The investigated PrFeAsO1-y single crystals were prepared using high pressure growth as described in[16]. The sample shape is a thin plate whose size is several hundred μm and the thickness is ~20 μm. The surface normal is c-axis direction. From the resistivity measurements structural and magnetic transition temperatures are TS~149 K and TN~139 K for mother compound (y=0), and superconducting transition temperature Tc was found to be ~43 K for superconducting sample (y~0.3) by measuring magnetic susceptibility. Judging from the variation in c lattice constant the error in oxygen deficiency for superconducting sample (y~0.3) is less than 0.1. The sample mosaic was surveyed before the measurements and it was found to be 0.1 to 0.8 deg. depending on samples and directions at the good position.
Inelastic x-ray scattering (IXS) measurements were performed at BL35XU of SPring-8 [17]. Except for the slit between sample and analyzer, a normal setting for IXS measurements was used with the incident x-ray energy of 21.75 keV using Si(11 11 11) reflections for backscattering monochromator and analyzers.To avoid the effect from the off-symmetrical position of the TA modes, the analyzer slit was set to 10(vertical) × 30(horizontal) mm2, which are one sixth and a half of the full gap in each direction. The beam size at sample position was about 70×80 μm2. The samples were mounted on a thin glass rod and set on the cold head of 4He closed-cycle refrigerator to be the <010> or <110> approximately vertical.

Fig. 1. Schematics of modified models and the simulated dispersion relation for (a) the in-plane soft model and (b) the clipped model. The line height of the simulated modes show the calculated IXS intensity for the models. In the schematic pictures the yellow and dark (light) pink circles represent iron atom on Fe-As plane and arsenide atom above (below) Fe-As plane. The blue arrows in the clipped model show the spin directions of each iron atom, and the red line width represents the strength of the correlation between iron atoms. The details of two models are described in the text. In the dispersion relation plots the black arrow in the dispersion is the TA phonon branch, and the red line corresponds to the Q for the observation in Fig. 2.
First principles calculations of PrFeAsO1-y and LaFeAsO were carried out using VASP [18] and a projector augmented wave (PAW) method [19]. Phonons were calculated via the PHONON package using adirect method [20]. The details are described in [9]. The two modified model calculations are done through the modification of force constant matrices obtained by the first principles calculations. The details aredescribed in [8,9].
Fig. 2 shows the IXS spectra of superconductor PrFeAsO1-y (y~0.3) at Q=(3.8,K,δ) (δ≈0) at room temperature. The spectrum of K=0 is strictly centered at purely longitudinal wave vector Q=(3.8,0,0),which corresponds to the red line in Fig. 1. At this point the Q-resolution is about ΔQ~(0.034, 0.012,0.034) r.l.u. including the effects of both the spectrometer state and the sample mosaic. Here about 40% of the ΔL variation is from the sample mosaic. In addition to elastic background at 0 meV, two peaks are observed at ~6 and ~9.5 meV which correspond to the TA and longitudinal acoustic (LA) phonon modes.The simulated intensity of two modified models are also plotted in Fig. 2 after the convolution of experimental resolutions both in Q and energy. The model calculations without the effect of the sample mosaic are indicated by the gray lines: it is clear that it is not negligible for the, more sensitive, clipped model. A scale factor was adjusted to match the experimental data, while the relative intensities between two modified models are kept. Though the intensity of the TA mode is decreased suddenly near K=0 as expected, the difference between two modified models is small, and it is difficult to determine which is a good model from this observation result. The IXS spectra are also measured for mother compounds PrFeAsO at room temperature and at 15 K. They were basically the same as those of superconductor PrFeAsO1-y (y~0.3) at room temperature (Fig. 2) within experimental error after the correction of Bose thermal factor. This identity in temperature and/or doping change has been already reported in [8].
Results and Discussion
The in-plane soft model is created by isotropic (lattice a direction is equivalent to b direction) modification to an isotropic non-magnetic calculation, while the clipped model is made by anisotropic modification to an anisotropic magnetic calculation. The anisotropy causes mixing of transverse and longitudinal phonon modes, and many branches show finite intensity in the magnetic calculation and the simulation of clipped model at purely longitudinal Q position as shown in Fig. 1. Observing this difference was our target.
The simulated intensity of TA mode at ~6 meV is small but predicted larger in the in-plane soft model than the clipped model. On the other hand, as stated above the intensity is exactly zero at purely longitudinal Q position in the in-plane soft model while that in clipped model has finite value as shown inFig. 1. This difference in model simulation and observed data comes from the effect of experimental resolution. In other words, the intensity at off-symmetrical position increases more rapidly in the in-plane soft model than in the clipped model (c.f. Fig. 2). This result suggests that the difference between two models is very small, and it is difficult to select a better model from the comparison of phonon intensities.
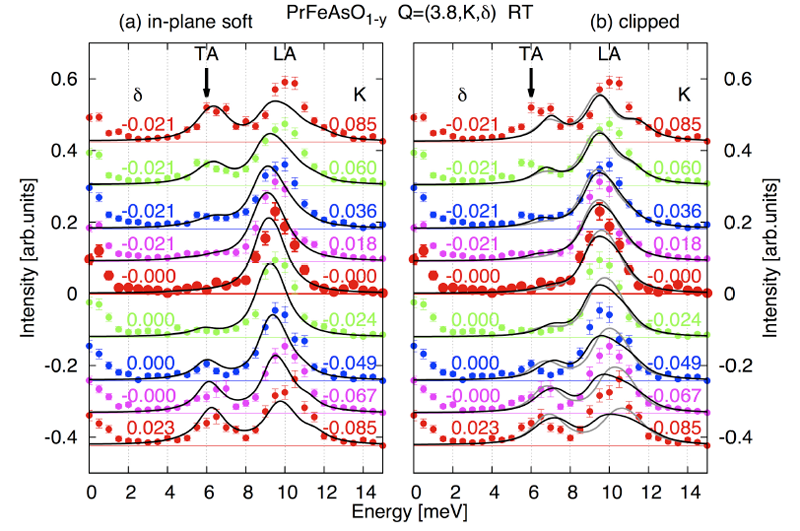
Fig. 2. IXS spectra of superconductor PrFeAsO1-y (y~0.3) along Q=(3.8,K,δ) (δ≈0) at room temperature compared with (a) in-plane soft model and (b) clipped model. Model calculations are convoluted in Q and energy resolution with and without the effect of sample mosaic (black and gray lines, respectively). Spectra are shifted vertically for clarity.
The observed spectra are almost symmetrical at +K and –K of Q=(3.8,K,δ) (Fig. 2). The modified calculation results are symmetric in in-plane soft model and asymmetric in clipped model. From this viewpoint the in-plane soft model seems to be better. However, the asymmetry in clipped model is easily affected by the sample mosaic as shown in Fig. 2. Moreover, as we reported in [8] the selection of the better model depends on the Q positions for the comparison, further consideration, and probably more sophisticated modeling is needed.
Challenges
In this study the comparison of the spectrum at symmetrical Q positions is found to be a tool to test two modified models. However, this effect is also suggested to be sensitive to small L component and therefore sample mosaic as shown in Fig. 2. Due to the layered structure the c plane can easily slip in the growth process and c direction in iron-based superconductors is not so good in general. Actually stacking faults in c direction are observed on the samples of the same batch studied. Good single crystals and perfect alignment will be necessary for further investigations.
Acknowledgements
This work was supported by Transformative Research-Project on Iron Pnictides (TRIP) from the Japan Science and Technology Agency, and performed under the NIMS-RIKEN-JAEA Cooperative Research Program on Quantum Beam Science and Technology.
References
[1] Y. Kamihara, T. Watanabe, M. Hirano, H. Hosono, J. Am. Chem. Soc. 130, 3296 (2008).
[2] C-H. Lee, A. Iyo, H. Eisaki, H. Kito, M.T. Fernandez-Diaz, T. Ito, K. Kihou, H. Matsuhata, M. Braden,K. Yamada, J. Phys. Soc. Jpn. 77, 083704 (2008).
[3] K. Horigane, H. Hiraka, K. Ohoyama, J. Phys. Soc. Jpn. 78, 074719 (2009).
[4] Y. Mizuguchi, Y. Hara, K. Deguchi, S. Tsuda, T. Yamaguchi, K. Takeda, H. Kotegawa, H. Tou, Y.Takano, Sup. Sci. and Tec. 23, 054013 (2010).
[5] H. Okabe, N. Takeshita, K. Horigane, T. Muranaka, J. Akimitsu, Phys. Rev. B 81, 205119 (2010).
[6] K Kuroki, H. Usui, S. Onari, R. Arita, H. Aoki, Phys. Rev. B 79, 224511 (2009).
[7] T. Saito, S. Onari, H. Kontani, Phys. Rev. B 82, 144510 (2010).
[8] T. Fukuda, A.Q.R. Baron, H. Nakamura, S. Shamoto, M. Ishikado, M. Machida, H. Uchiyama, A. Iyo,H. Kito, J. Mizuki, M. Arai, H. Eisaki, Phys. Rev. B 84, 064504 (2011).
[9] T. Fukuda, A.Q.R. Baron, H. Nakamura, S. Shamoto, M. Ishikado, M. Machida, H. Uchiyama, A. Iyo,H. Kito, J. Mizuki, M. Arai, H. Eisaki, J. Phys. Soc. Jpn. 80, SB015 (2011).
[10] J. Zhao, D.T. Adroja, D.-X. Yao, R. Bewley, S. Li, X.F. Wang, G. Wu, X.H. Chen, J. Hu, P. Dai,Nature Phys. 5, 555 (2009).
[11] T.-M. Chuang, M.P. Allan, J. Lee, Y. Xie, N. Ni, S.L. Bud’ko, G.S. Boebinger, P.C. Canfield, J.C.Davis, Science 327, 181 (2010).
[12]T. Shimojima, K. Ishizaka, Y. Ishida, N. Katayama, K. Ohgushi, T. Kiss, M. Okawa, T. Togashi, X.-Y.Wang, C.-T. Chen, S. Watanabe, R. Kadota, T. Oguchi, A. Chainani, S. Shin, Phys. Rev. Lett. 104,057002 (2010).
[13] J-H. Chu, J.G. Analytis, K. De Greve, P.L. McMahon, Z. Islam, Y. Yamamoto, I.R. Fisher, Science 329, 824 (2010).
[14] M.A. Tanatar, E.C. Blomberg, A. Kreyssig, M.G. Kim, N. Ni, A. Thaler, S.L. Bud’ko, P.C. Canfield,A.I. Goldman, I.I. Mazin, R. Prozorov, Phys. Rev. B 81, 184508 (2010).
[15] M. Yi, D. Lu, J.-H. Chua, J.G. Analytis, A.P. Sorini, A.F. Kemper, B. Moritz, S.-K. Mo, R.G. Moore,M. Hashimoto, W.-S. Leea, Z. Hussain, T.P. Devereaux, I.R. Fisher, Z.-X. Shen, Proc. Natl. Acad. Sci.USA 108, 6878 (2011).
[16] M. Ishikado, S. Shamoto, H. Kito, A. Iyo, H. Eisaki, T. Ito, Y. Tomioka, Physica C 469, 901 (2009).
[17] A.Q.R. Baron, Y. Tanaka, S. Goto, K. Takeshita, T. Matsushita, T. Ishikawa, J. Phys. Chem. Solids 61,461 (2000).
[18] G. Kresse, J. Hafner, Phys. Rev. B 47, 558(R) (1993). G. Kresse, J. Furthmüller, Comp. Mater. Sci. 6,15 (1996). G. Kresse, J. Furthmüller, Phys. Rev. B 54, 11169 (1996).
[19] P.E. Blöchl, Phys. Rev. B 50, 17953 (1994). G. Kresse and D. Joubert, Phys. Rev. B 59, 1758 (1999).
[20] K. Parlinski, Z.Q. Li, Y. Kawazoe, Phys. Rev. Lett. 78, 4063 (1997).
ⒸJASRI
(Received: December 3, 2014; Early edition: March 25, 2015; Accepted: June 29, 2015; Published: July 21, 2015)