


Volume8 No.3
SPring-8 Section A: Scientific Research Report
剪断流条件下のDNA二重ラセン溶液で観察されたSAXS信号
SAXS Signals from Double-Stranded DNA under Shear-Flow Conditions
a中央大学, bESRF, cお茶の水女子大学, d広島県立大学, e (公財)高輝度光科学研究センター
aChuo University, bESRF, cOchanomizu University, dPrefectural University of Hiroshima, eJASRI
- Abstract
-
SAXS signals from the DNA of salmon spermatozoa in an aqueous solution were analyzed using a rheometer-device, which controlled the rate of shearing during SAXS observations. When shearing rate > 1000 s−1 was applied to the DNA suspension, DNA strands were not aligned as observed with other biological filaments, but a stable diffraction peak approximately ranging 1.7–1.8 [nm−1] of Q-values were observed. We compared our observation with simulated SAXS signals.
Keywords:DNA, solution structure, scattering, SAXS simulation
Background and Purpose
Under in vivo or in vitro conditions, any chemical or physical conditions that would modify the structure of double stranded DNA (dsDNA) are assumed to affect gene expression and the stability of DNA molecules. Thus, the solution structure of DNA-strands has been a major target in the field of structural biology. However, direct methods to investigate the solution structure of DNA has been hampered due to technical limitations. For example, the nuclear magnetic resonance technique has a limitation of base-pair numbers up to several tens [1]. Circular dichroism (CD) may be useful to know the structure of DNA molecules in solution. Although in an indirect way, it was revealed that ethanol, magnesium, electric field and some salts accelerated structural conversions [2,3]. The dynamic structural changes of DNA in the solution were analyzed using atomic force microscopy under the limitation—resolution in nm-range, to recognize the details, but we needed to fix DNA strands on stiff substrate. Finally, cryo-electron microscopy would be our best choice to recognize the structural details, but we cannot easily know the structural dynamics in solution from fixed or frozen images. X-ray fiber diffraction is a direct method to determine the solution structure of DNA strands, but so far, DNA specimens in a dried or partially hydrated gel-state have been a major target for investigation. In this study, we applied our original method [4-6] for aligning biological fibers such as microtubules, axonemes, and actin fibers in various solutions to native DNA specimens prepared from salmon spermatozoa. Our apparatus was made of two parallel disks separated at 0.3–0.4 mm apart, one of which was placed on an AC motor to rotate. DNA suspension was placed between the disks, and by changing the speed of disk rotation, we applied various shearing speeds to the DNA specimen during the observation of SAXS signals from DNA. Unfortunately, we could not orient DNA strands to the shearing flow, however for the first time, the diffraction signals reflecting a certain intrinsic structure of DNA double strands in solution were observed. We compared the observed data with simulated SAXS or fiber diffraction signals. It was suggested that signals coming from the strand pitch of the DNA helix were detected with our shearing flow techniques.
Materials and method
DNA specimen
DNA specimen from salmon sperm was used for this experiment (Fujifilm Wako Pure Chem. Corp., Osaka, Japan). We estimated the mean length of DNA strands to be 200 bps (Fig. 1), which did not change even after X-ray irradiation for fiber diffraction. Thus, we assumed that there were no major changes in strand length even after mechanical shearing or X-ray irradiation up to 600-s exposure. Before the experiments, the DNA specimen was dissolved in heated distilled water at 50°C till it attained a volume of 250 mg/mL after which it was allowed to cool gradually and incubated at room temperature for 5 h to remove the remaining single-stranded DNA.
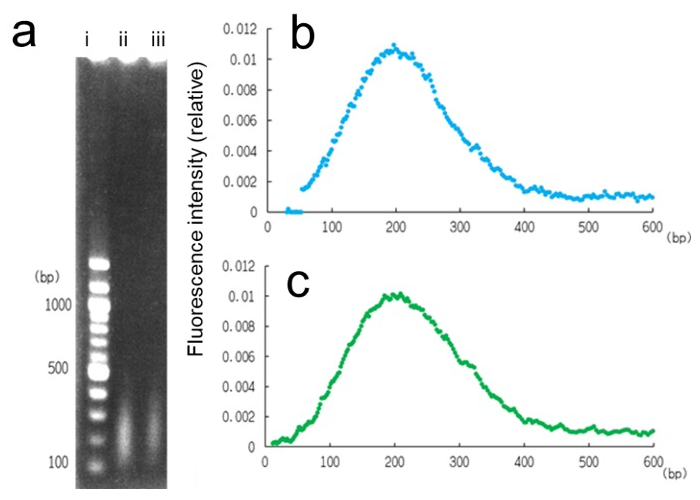
Fig. 1: Analysis of the molecular size of DNA used for X-ray fiber diffraction. a, Electrophoresis of DNA specimen before (ii) and after (iii) X-ray irradiation. The ladder in (i) shows DNA stranded with 100 bps. b and c, fluorescence density analysis showing the distribution of base-pair numbers (200 ± 79 and 200 ± 84) before and after the experiments, respectively. The measured length was slightly longer than the persistence length of dsDNA [7,8]. Averaged from four independent electrophoresis.
Small-angle X-ray scattering (SAXS) analysis
DNA specimen was placed in a rheometer-type shearing apparatus previously described by Sugiyama et al.[4]; Kamimura et al.,[6]. In brief, ca. 80 μL of DNA solution was placed between a quartz disk with a diameter of 18 mm (thickness, 0.2 mm) and a ring-shaped copper plate separated with a gap of 0.32 mm. The quartz disk was then spun at approximately 5–15 revolutions per seconds (rps) by an AC motor (HM2225 F12H, Technohands, Kanagawa, Japan).
Synchrotron X-ray beam (BL45XU, SPring-8, Hyogo, Japan) was then introduced to the DNA suspension from the side of the quartz disk, we then collected diffracted signals coming through a small quartz window with a diameter of 3 mm perforated on the copper plate. SAXS signals were acquired with a cooled II-CCD (C4880-10-14A; Hamamatsu Photonics, Shizuoka, Japan) with 0.5-s exposure. After 50 s at a room temperature of 20°C we recorded 100 diffraction images. Wavelength and beam-size of 0.1 nm and 0.3 × 0.2 mm, respectively, were used. Camera length was 728 or 962 mm. Acquired images were analyzed using the ImageJ software (version 1.52t, NIH). To make SAXS-profiles from recorded images, diffraction signals were rotationally averaged and intensity profiles from the center was determined.
By changing the speed of the AC motor (at approximately 0–20 rps), we controlled the shearing rate (![]() ) of the flow condition given to the DNA specimen. Shearing rate was estimated using the equation:
) of the flow condition given to the DNA specimen. Shearing rate was estimated using the equation:
![]() =2πfR/d
=2πfR/d
where, R and d are the radius of the rotating disks (7.5 mm) and specimen thickness (0.32 mm), respectively. The calculated shearing rate given to the DNA specimen was approximately 0–3000 s−1. To test whether there was any damage due to X-ray irradiation and mechanical shearing, by electrophoresis we compared the mean base length before and after the experiments. Both shearing and X-ray irradiation did not cause modifications in the base pair length of the DNA (Fig. 1). Under our experimental conditions, the shearing stress given to DNA specimen was estimated to be ca 3 [N/m2], this indicates that if this shearing stress is averaged homogeneously by each molecule a shearing force of < 1 pN was given to each DNA molecule. Since continuous shearing forces were given to the DNA suspension in our experiments, it would be unlikely that DNA strands tangled with each other to make bigger clusters.
We also executed simulations of SAXS signals using DNA-protein data bank (PDB) data produced by 3D-simulation [9] to compare with our experimental data. For these purposes, three programs, Crysol [10,11] and a new program Scatfit were used. Scatfit was programmed originally by one of the authors (A. Longo) to cover the Q-range up to 10 nm−1 by simplifying the calculation of Debye scattering, where all atoms given in the PDB data are to have similar weights.
Results and Discussion
Without shearing force, we did not observe signals with specific peaks; however, under the condition with shearing flow of approximately 1,000 s−1, different patterns of diffraction appeared as shown in Fig. 2 around Q-value of approximately 0.17–0.18 nm−1. As we will discuss below, using three simulation methods, the peak does not correspond to any estimated peaks of SAXS signals. The position of the peak, we observed almost corresponds to the helical pitch of the double strands of B-form DNA, 3.5 nm, which is usually observed using the X-ray fiber diffraction technique from dried DNA gels. From our preliminary observations, after prolonged shearing we discovered that the peak position showed a gradual shift toward those with high Q-values. Time-course analysis of the diffraction peak shift under various conditions is now being executed in more detail.< /p>
It has been shown that after fluorescence labeling DNA short strands showed alignment under shearing conditions [12,13] though the shearing rate was much lower (< 10 s−1) than the conditions we used. Similar aligning behavior of the DNA strands would occur under the present conditions.
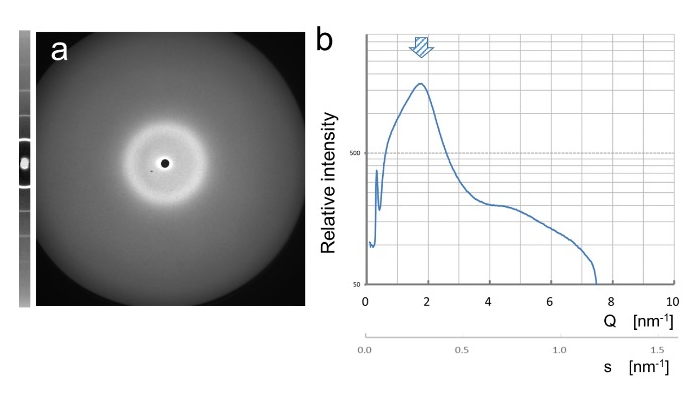
Fig. 2: X-ray diffraction of DNA from salmon sperm suspended in an aqueous solution under shearing-flow condition (1,000 s−1). (a) thirty diffraction images acquired within 1-s exposure were averaged. Standard scattering data with lead stearate is shown on the left side. (b) measured profile of scattering intensity (log scale) vs Q-value [nm−1]. Axis with calculated s-value (Q/2π) is also shown. Arrow in b indicates the peak position of d = 3.5 nm (Q = 0.18 nm−1, s = 0.286 nm−1).
To obtain more accurate insight into the experimental data, we executed the simulation of solution scattering from B-DNA. We used three programs to simulate the scattering profile of different lengths of B-DNA, 5–80 bps (Fig. 3). All the simulated profiles equally showed broad plateaus in the range of 4–6 nm−1 of Q-values, which correspond to s-values of 0.64 –0.95 nm−1, i.e., 1.0–1.6 nm periodicity in the reciprocal spacing. The new program, Scatfit, developed by one of the authors (A. Longo) is useful for simulating SAXS for long DNA molecules (up to 100 bps) in a wide range of Q-values.
Simulation results in Fig. 3 indicate that the broad SAXS peak in the range of 4–6 nm−1 of Q-values reflects scattering coming from the internal structure of DNA, i.e., helical pitches, as the intensity increased depending on the number of base-pairs. However, our simulation could not show any specific peaks around the 1.7–1.8 nm−1 of Q-values (d=3.5 nm) as observed in our experiments (arrow in Fig. 2). In the same Q-range, we also simulated the diffraction by making a rotational averaging of B-DNA fiber diffraction (Fig. 3d), mimicking the situation where DNA molecules are not aligned but bent or dispersed in a plane perpendicular to the X-ray beam [14]. This simulation also fails to show the single peak we observed.
We cannot completely deny the possibility that the diffraction we observed (Fig. 2) comes from entangled clusters of DNA molecules and there was a certain nematic interaction among DNA double-strands in the specimen with a high concentration we used. However, it is obvious a single peak of 1.7–1.8 nm−1 of Q-values showed some structural regularity in the DNA suspension. DNA with fixed length shorter than the persistence length, 100–150 bps, of DNA double-strand [11,15] should be used in the future. We expect that our method of X-ray diffraction analysis under shearing-flow conditions would be a powerful tool for observing the solution structure and dynamics of native DNA double-stranded molecules.
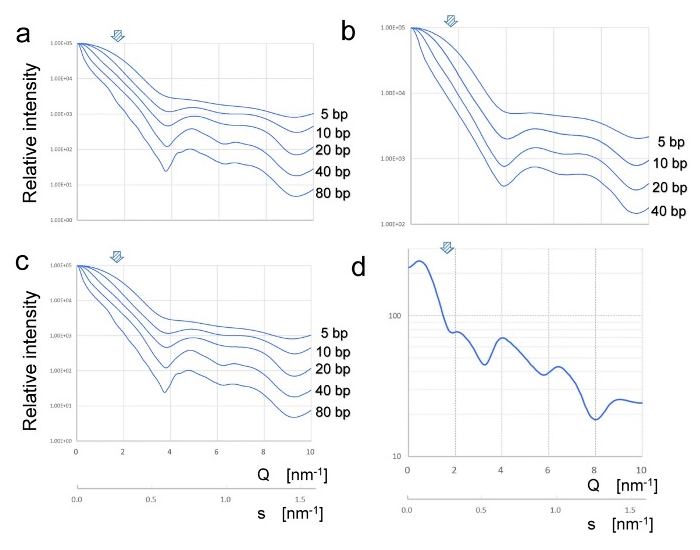
Fig. 3: Simulation of diffraction signals from DNA in solution. a–c indicates SAXS simulations with tree methods, Crysol, AXES, and Scatfit, respectively. PDB data of DNA strand corresponding to human TUBA2 was used for these simulations. Comparison of SAXS signals from B-DNA of 5–80 base pairs are shown. These results are almost consistent with those reported previously [16]. d, an expected profile of diffraction obtained from rotational averaging of B-DNA fiber diffraction. Arrows indicate the peak position of DNA diffraction observed in this study.
Acknowledgement
This works has been mainly done by Y.F. during his master course. The authors are grateful to the beamline scientists of BL45XU (SPring-8) and BM28/DUBBLE (ESRF) for useful discussions to finish this publication. This work was supported by the grant from the Inst. Sci., Eng., Chuo Univ. and JSPS KAKENHI (16K07328, 17H03668, 19K06602) to SK.
References
[1]: Nadeau, J. G. & Crothers, D. M., Proc. Natl. Acad. Sci., 86, 2622-2626 (1989).
[2]: Ivanov, V. I., Minchenkova, L. E. et al., J. Mol. Biol., 87, 817-833 (1974).
[3]: Ivanov, V. I & Minyat, E. E., Nucleic Acids Res., 9, 4783-4798 (1981).
[4]: Sugiyama, T., Miyashiro, D. et al., Biophys. J., 97, 3132-3138 (2009).
[5]: Oiwa, K., Kamimura, S. & Iwamoto, H., Methods Cell Biol., 91, 89-109 (2009).
[6]: Kamimura S., Fujita, Y. et al., Cytoskel., 73, 131-144 (2016).
[7]: Brinkers S., Dietrich H.R. et al., J. Chem Phys., 130, 215105 (2009).
[8]: Guilbaud, S., Salome, L. et al. Phys. Rev. Lett., 122, 028102 (2019).
[9]: Li et al., 2003, 2019; http://x3dna.org/
[10]: Svergun D. I., Barberato C. & Koch M. H. J., J. Appl. Cryst., 28, 768-773 (1995).
[11]: Grishaev, A., Guo, L.A. et al., J. Am. Chem. Soc., 132, 15484-15486 (2010).
[12]: Smith D. E., Babcock H. P. & Chu, Science, 283, 1724-1727 (1999).
[13]: LeDuc, P., Haber, C. et al., Nature, 399, 564-566 (1999).
[14]: Jeffery, G. B., Proc. R. Soc. Lond. A., 102, 161-179 (1922).
[15]: Brunet, A., Tardin, C. et al., Macromolecules, 48, 3641 (2015).
[16]: Nguyen, H. T., Pabit S. A. et al., J. Chem. Phys., 141, 22D508 (2014).

(Received: June 26, 2020; Accepted: October 23, 2020; Published: October 29, 2020)