


Volume8 No.2
SPring-8 Section A: Scientific Research Report
Mechanical Optimization of Biomineralized Materials of Marine Origin
aUniversity of Copenhagen, bTechnical University of Denmark, cJASRI
- Abstract
-
Biomineralization is utilised by animals to form durable yet lightweight structures, e.g. bones, teeth and shells. Here we focus on the microstructure of the exoskeleton of the heart urchin because of its unusual strength. This species shares many features with sea urchins but deviates in appearance because it has adapted to withstand high pressures because it is buried in the sand.
Keywords: Sea urchin, materials properties, biomineralization
Background and Purpose
Nature can give us an important insight into how to produce functional and highly efficient materials by copying nature’s design strategies, a process called biotemplating. Biomineralized material produced by marine species, such as sea urchins [1], are thus one possible route to create new lightweight yet durable materials. Before this experiment, we had investigated the species heart urchins (Echinocardium cordatum), where we had already recorded tomograms using laboratory equipment for some of the samples. They show an intricate, almost airy network (Fig. 1), where porosity changes quite dramatically over the sample. The density of the material itself, however, is quite uniform. Preliminary powder XRD demonstrates that the bulk of the material consists of magnesium rich calcite, i.e. calcium carbonate where some of the calcium ions have been replaced by magnesium.
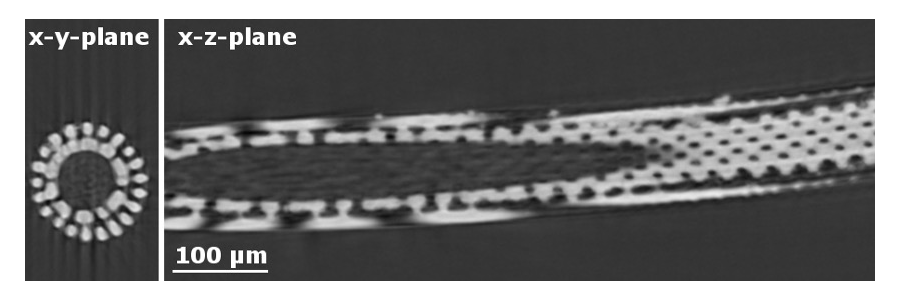
Fig. 1. X-ray microtomography slides of a sea urchin spine showing an intricate internal structure.
By segmenting, meshing and importing the data into finite element software, we were able to reconstruct typical mechanical loading conditions and found that the shell indeed distributes the applied stress uniformly so that local stress does not lead to fracturing [2]. To fully understand the microstructure of the shell, we need to know the spatial variance in orientation of the calcite crystals and their composition. This is because calcite’s mechanical properties change with orientation along and perpendicular to the crystallographic c-axis. We anticipated that the animal makes use of this difference to optimize load transfer as well.
Experimental Summary
All characterization at BL20XU was performed using an X-ray energy of 23 keV. Conventional tomographic scans were performed to image the microstructure of the carbonate network in the heart urchin spine (Fig. 1). 1800 projections over 180 degrees rotation were recorded with a 2048x2048 pixel detector with a pixel size of 311 nm exposing for 200 msec. Initially 30 dark fields were collected and 30 bright field images were collected before and after the projections for image correction. The 3D tomography image was obtained using filtered back projection software at the beamline.
The local misorientation variation of the single crystalline sea urchin spine was to sought mapped using 3DXRD microscopy also with an X-ray energy of 23 keV. We used a line beam approach (beam height 12 µm) that covered the full width of the spine. Two sets of diffraction data were recorded (exposure time 200 msec) while rotating the sample over 200 degrees in steps of 0.06 degrees. First we recorded far-field data on CCD area detector 2048 x 2048 pixels with a pixel size of 18.75 µm in order to determine the average crystal orientation of the spine. Second we recorded near-field diffraction data using a high resolution detector (Photron SA2, 4.56 µm pixel size).
The position of the diffraction peaks in the far-field data were identified using peaksearch from the ImageD11 package [3], which used the Fabio python module [4] to read the image files. Subsequently, the peak positions were transformed into scattering vectors (g-vectors) also using the ImageD11 software. The program GrainSpotter [5] determined the single crystal average orientation of a slice of the spine using the far-field data set. This crystal orientation was used subsequently to try to determine a spatially resolved orientation map of the same slice using GrainSweeper [6], which is developed by S. Schmidt at the Technical University of Denmark to identify all diffraction peaks in our near field images and from these reconstruct the local crystal orientations.
Results and Discussion
The reconstruction of the orientation map was performed, with GrainSweeper (for details about the program, please consult [6] and [7]; for a study using GrainSweeper on data from BL20XU see [8]), using a series of different segmentations of the near-field direction images into binary images, e.g. every pixel is assigned as having being hit by a Bragg peak or not. The reconstructed maps were heavily biased by the choice of segmentation. The best orientation map is shown in Figure 2 was made using the sweeper2png software, that is part of GrainSweeper [7]. This should in principle provide us with an accurate spatial map of the crystal orientation but it seems that the resolution of the experiment is not high enough to separate peaks from different parts of crystal. If that had been the case the map should have looked as a course map of the left side of Fig. 1. with a colour code on top, signifying the local orientation of the map. Instead, we have a map that fills out more than the full diameter of the spine. We did test a number of ways to segment the near field diffraction image as we suspected that our segmentation threshold was too low such that we did not catch the fine structure of the diffraction peaks. Attempts to use higher thresholds unfortunately only lead to subsections of the map seen in Fig. 2 but still did not look like a slice through the spine structure. Since we have reconstructed a crystal in orientation in areas where there is no material in the spine, we are not confident that the orientation map is accurate and thus we cannot determine if the spine is made out of one single crystal or a large number of nearly parallel crystallites as proposed in [9].
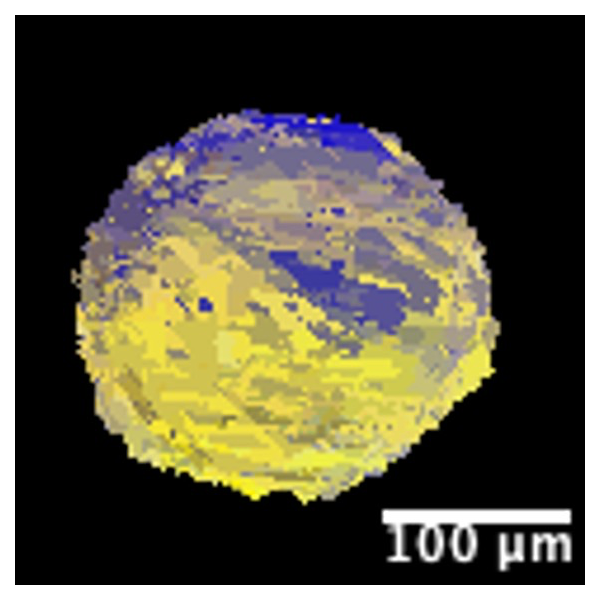
Fig. 2. A slice of one misorientation map of the single crystal in the heart urchin spine. The colors represent a misorientation range of up to 0.51 degree from the average orientation. Dark blue and bright yellow indicate that the local reconstructed orientation is furthest from the average crystal orientation.
Challenges
We have attempted to reconstruct the crystal orientation in our data but it seems the resolution (pixel size and point-spread function) of the experiment is not sufficient to detect the minute differences we expected. Furthermore, the detector has low dynamic range, which might lead to the loss of internal variations of the signal. This combined by the difficulty in making a reasonable segmentation of the diffraction images creates a large uncertainty in the reconstructed maps. We hope that it will be possible in the future to make a similar study but with a higher spatial and angular resolution of the detector (i.e. smaller pixels, preferably a factor of 5), along with an improved peak segmentation, allowing us to determine the nature of the heart urchin spine. It is difficult to state an exact value of what is needed because we do not the real misorientation and the spatial scale of their variation but since we cannot reconstruct material in area of no material, e.g. in the hollow space at the center of the spine, it is clear that the current setup or algorithms are not sufficient at the moment.
References
[1] H. A. Lowenstam, On Biomineralization, Oxford University Press, 123-134, (1989).
[2] D. Müter et al., Acta Biomater. 23, 21-26 (2015).
[3] J. P. Wright, ImageD11, http://fable.svn.sourceforge.net/svnroot/fable/ImageD11/. ESRF, Grenoble, France (2005).
[4] E. B. Knudsen et al., J. Appl. Cryst. 46, 537-539 (2013).
[5] S. Schmidt, J. Appl.Cryst. 47, 276-284 (2014).
[6] S. Schmidt et al., Scripta Mater. 59, 491-494 (2008).
[7] S. Schmidt, GrainSweeper. Available at svn.code.sf.net/p/fable/code/GrainSweeper (2015).
[8] J. M. Dake et al., PNAS 113(41), E5998-E6006 (2016).
[9] K. Okazaki, R. M. Dillaman, K. M. Wilbur, Biol. Bull. 161, 402-415 (1981).
(Received: September 30, 2019; Early edition: June 26, 2020; Accepted: July 6, 2020; Published: August 21, 2020)