


Volume8 No.2
SPring-8 Section A: Scientific Research Report
High Pressure Crystalline Structures of Se at Low Temperature
aUniversity of Saskatchewan, bUniversity of Ottawa, c Japan Synchrotron Radiation Research Institute (SPring-8/JASRI)
- Abstract
-
The low-temperature high-pressure structures of elemental selenium (Se) have been characterized by in-situ x-ray diffraction in a diamond anvil cell. A phase diagram appropriate for the P-T conditions is constructed from the results. Unlike the closely related elemental barium (Ba), no new structure was found by first cooling the sample to 10 K and then compressed to 34 GPa. The results confirmed the structure of the superconducting phase observed at 13 GPa,
Keywords: High-pressure, Low-temperature, X-ray powder diffraction, Phase diagram
Background and Purpose
One common feature of high pressure elements is the ubiquitous existence of a superconducting state. This novel phenomenon may be rationalized by the unavoidable metal-to-insulator transition regardless the initial state of the materials is a metal or an insulator. The transition may be induced by an electronic and/or structural instability leading to a superconducting state. The electronic stability is often attributed to the formation of a charge-density wave (CDW) distortion. This suggestion is problematic s the co-existence of charge density wave and superconductivity is a rare event. Moreover, in some main group elements, the superconductivity state is apparently associated with the transformation to a highly complex or an incommensurate modulated structure at room temperature. This has been observed in Ba [1], I2 [2], and the group VI elements, S [3], Se [4] and Te [5]. In fact, the distortion by CDW often times is found to leading to an insulating state due to the opening of a band gap.
Recently, from low temperature X-ray diffraction under quasi-hydrostatic condition we have shown for the case of Cs and Ba that the transformation to known complex structures do not exist at conditions where a superconducting state prevails. This observation casts doubt on correlating superconductivity with a structural transformation to a complex structure. To date, the most comprehensive theoretical characterization of a superconducting state and the crystal structure have been that of elemental sulphur. In this case, superconductivity with a critical temperature range from 14 - 17 K has been found at pressures ranging between 90 – 160 GPa. At room temperature, sulphur has also been found to adopt an incommensurate modulated structure. [4] Density functional theory calculations show there are extensive nesting of the Fermi surfaces for the room temperature structure. From the calculations, it was then concluded that the nesting (CDW instability) may be the origin of the superconductivity. [6] It is well known, however, that the observed high pressure structures of sulphur depend strongly on the pressure-temperature (P,T) path. It should be mentioned that the phase boundaries of these crystalline structures have not been fully determined at low temperature. And it is worth noting that superconductivity in sulphur had been reported as early as 1978. In the reported studies, it was found that the superconducting state is affected by the (P,T) path. Selenium also exhibits superconducting properties when compressed to 13 GPa. The high-pressure selenium structures at room temperature have been resolved recently. From these results, it is postulated that phase VII, presenting an incommensurate modulated structure, may be responsible for the arising of a superconducting state.
Gathering all the information in the literature and our recent observations of the different structures existing close to the superconducting critical temperature in other elemental dense solids, we advance that the assertion that superconductivity is associated with a complex commensurate modulated and incommensurate modulated high pressure structures may not be valid. This is supported, for instance, by results on Ba in which a new common non-modulated structure was found as phase VI. [7] Subsequently, Phase VI was found to show exhibit superconductivity with a critical temperature very close to the theoretical prediction [8]. Therefore, a discrepancy exists between the room temperature incommensurate and modulated structure [9] and the simple low temperature hexagonal structure actually observed for Phase VI of Ba. Therefore, it pertinent to investigate the phase diagrams of Se and S under high pressure and low temperature by X-ray diffraction, with, if possible, simultaneous measurements of the electrical conductivity under the same conditions. The pressure region of interest is the onset of the incipient superconductivity. At 13 GPa, the critical temperature for Se is 7.8 K and 14 K for sulphur at 89 GPa. In this study, we have carried out X-ray diffraction experiments close to the reported superconductivity states to (i) ascertain the structure of superconducting Se (ii) derive the low temperature-high pressure phase diagram and Se. Due to the limited time available, no measurement was performed on S, as planned for this project.
Experimental Summary
High purity Se powder was loaded in diamond anvil cells suitable for cooling, using helium as the pressure transmitting medium. Samples in the pressure cells were constrained in stainless steel gaskets. No pressure transmission medium was used in the experiment. The diamond anvil cell was fitted on the cold finger of a He closed-cycle cryostat specially designed for X-ray diffraction and operated at BL10XU beam line of SPring-8. Pressure were measured by photo-excited luminescence of ruby using a proper temperature correction. [10] In order to explore the phase diagram and structural phase transitions of selenium, X-ray diffraction patterns (from X-ray diffraction images) were recorded as function of pressure and as a function of temperature. X-ray diffraction images were obtained using a focussed X-ray beam monochromatized at a wavelength of 0.4137 Å. X-ray diffraction from a CeO2 powder sample was used to refine the incident radiation wavelength and calibrate the sample-to-detector distance and the detector orientation with respect to the direct X-ray beam. Details with regards to the beam line and X-ray diffraction experiment at high pressure/temperature are given elsewhere. [11-12] After background subtraction, the X-ray diffraction patterns were analyzed by a Rietveld refinement using the DASH software. [13] A plan to measure electrical conductivity (using proper electrical probes in contact with the sample) in conjunction with X-ray diffraction at the different pressure/temperature conditions was given up as the lowest temperature that could be reached in the cryostat in our experiment was to not low enough to detect signs of superconductivity.
Results and Discussion
・Several polymorphic forms of Se have been found at low temperature and high pressure.[14] A schematic illustration of the P-T (pressure-temperature) regions in which these polymorphs were determined is shown in Fig. 1.
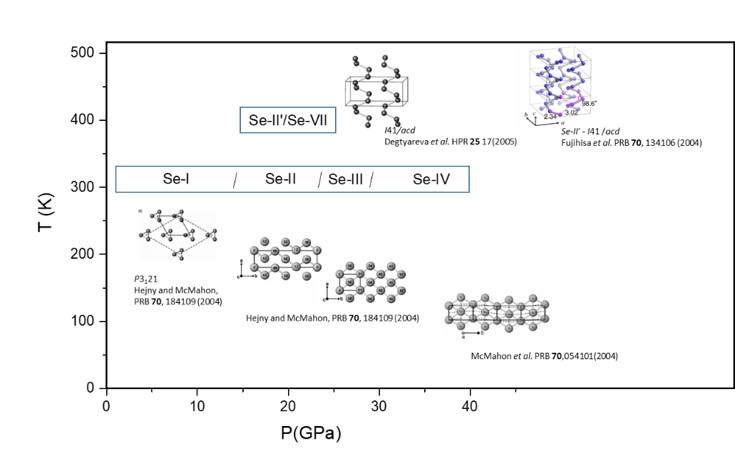
Fig. 1. A schematic illustration of the stable high pressure polymorphs of Se.
Although the structures of the polymorphs are known, the phase stability and the phase boundary have not be well determined. To explore the low temperature-high pressure phase diagram of Se, X-ray diffraction experiments proceeded following the P-T paths depicted in Fig. 2. The Se sample was first cooled to 10 K and compressed to 34 GPa (A). Then, the sample was heated to 150 K (B) and decompressed to 18 GPa (C). At 18 GPa, the sample was further heated to 270 K (D) and the pressure reduced to 10 GPa (E). Then the sample was allowed to cool to 160 K (F) and to fully be compressed back to 34 GPa (G).
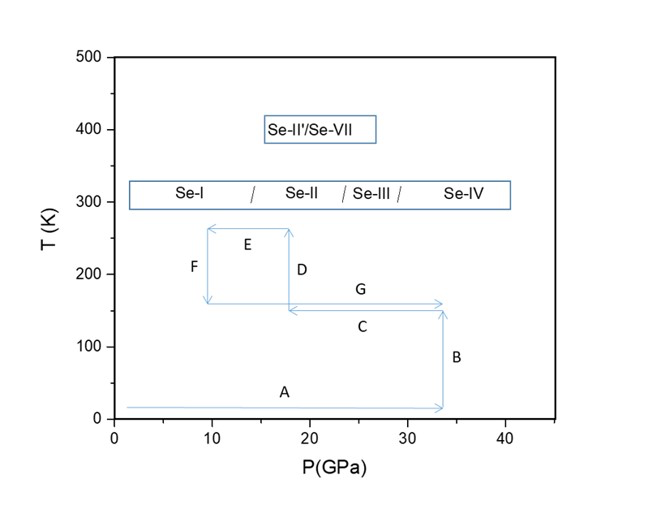
Fig. 2. P-T paths explored by X-ray diffraction.
A large number of X-ray diffraction images were recorded along these paths. A typical X-ray diffraction pattern and result of the structural refinement are shown in Fig. 3. Following the same procedure, we have characterized all the crystalline structures measured in the P-T region presented above. The results allow us to construct a low-temperature-high pressure phase diagram for Se.
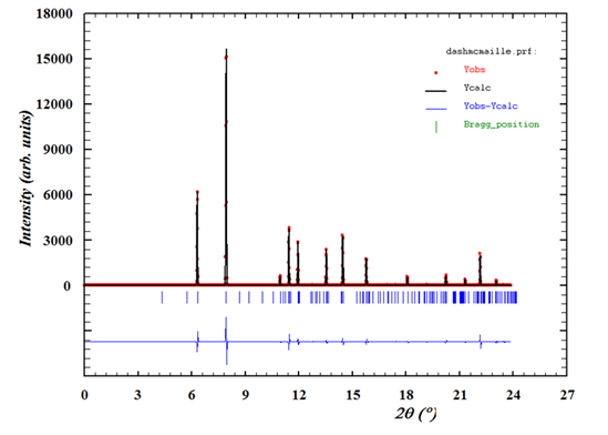
Fig. 3. A comparison between the measured and refined X-ray diffraction patterns of dense Se.
From the experimental data the phase diagram of Se from room temperature to 10 K over the pressure range 0 – 34 GPa can be constructed. The results are shown in Fig. 4. Se-I, the stable structure under ambient conditions is stable up to 19 GPa at 10 K. Se-II, obtained from cooling of Se-IV to 400 K has a fairly narrow region of stability and transforms to Se-I at 140 K and 17 GPa. It is interesting to note that the phase boundary between Se-II and Se-IV is rather flat, indicating very small change in density and the enthalpy between the two phases. Se-III becomes more stable above around 20 GPa. It is disappointing that we were not able to perform X-ray diffraction and electrical conductivity simultaneously; the results for Se, like those of Ba, show that the superconducting phase found at 13 GPa is still within the stability field of Se-I, a known and rather common crystalline structures.
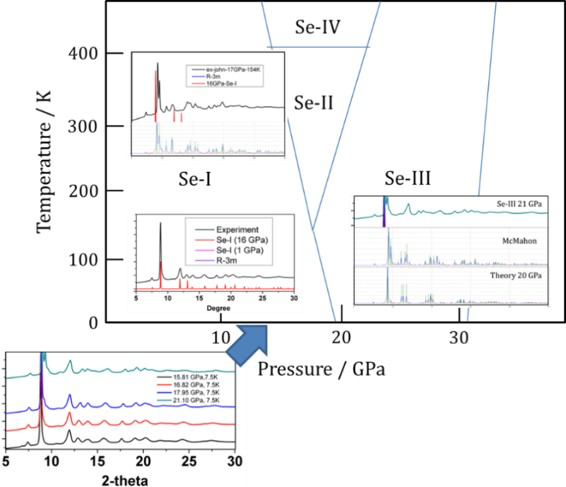
Fig. 4. Experimental low-temperature high-pressure phase diagram of elemental selenium.
Challenges
The challenge is on the simultaneous measurements of the diffraction patterns and electrical resistivity at very low temperature under which superconductivity has been observed. The diamond anvils are often fragile under these conditions. However, experimental result on dense S and Se are expected to be invaluable to the fundamental understanding of the mechanism leading to the superconductivity.
References
[1] J. Wittig and B. T. Matthias, Phys. Rev. Lett., 22, 634 (1969); K. J. Dunn and F. P. Bundy, Phys. Rev. B, 25, 194 (1982).
[2] K. Takemura, et al., Nature, 423, 971 (2003).
[3] V. V. Struzhkin, et al., Nature, 390, 382(1997).
[4] J. Wittig, Phys. Rev. Lett., 15, 159 (1965).
[5] Y. Akahama, et. al., Solid State Comm., 84, 803, (1992).
[6] O. Degtyareva, et al., Phys. Rev. Lett., 99, 155505 (2007).
[7] S. Desgreniers, et al., Appl. Phys. Lett., 107, 221908 (2015).
[8] D. E. Jackson, et al., Phys. Rev. B, 96, 184514 (2017).
[9] R. J. Nelmes, et al., Phys. Rev. Lett., 83, 4081 (1999).
[10] K. Nakano, et al., Japanese J. Appl. Phys., 39, 3A (2000).
[11] Y. Ohishi et al., High Press. Res., 28, 163 (2008).
[12] N. Hirao et al., Matter Radiat. Extremes, 5, 018403 (2020).
[13] W. I. F. David, et al., J. Appl. Cryst., 39, 910 (2006).
[14] O. Degtyareva, High Press. Res, 30, 343 (2010).
(Received: March 25, 2020; Early edition: June 26, 2020; Accepted: July 6, 2020; Published: August 21, 2020)