


Volume8 No.2
SPring-8 Section A: Scientific Research Report
Role of Nb in Improving the Cyclic Stability of V-Ti-Cr Alloys
aAIST, bJAEA, cQST, dToyota Central R&D Labs., Inc., eJMC
- Abstract
-
The degradation of reversible hydrogen storage capacity of V-Ti-Cr alloys can be greatly reduced by dissolving a small amount of Nb, yet the exact role of Nb in improving cyclic stability is not known. In this study, we have investigated local structural changes in V0.25Ti0.25Cr0.5H2 and V0.25Ti0.25Cr0.45Nb0.05H2 during hydrogen cycling using the X-ray atomic pair distribution function and the extended X-ray absorption fine structure spectra to understand the effect of Nb. Our study suggests that during hydrogen cycling large Ti atoms are dragged to dislocation cores to reduce strain induced by dislocations. This leaves Ti-poor regions near dislocations for which higher hydrogen gas pressure is required for hydrogen uptake. It is most probable that Nb prevents the segregation of Ti.
Keywords:hydrogen storage materials, metal alloys, EXAFS
Background and Purpose
One of important issues of V-based alloys for hydrogen storage is poor cyclic stability, i.e. their reversible hydrogen storage capacity gradually decreases as the hydriding and dehydriding process is repeated [1]. Various approaches to improving cyclic stability have been tested. One of interesting approaches is adding a small amount of Nb or Fe in V-Ti-Cr alloys [2-4]. The effect of Nb is particularly impressive. However, the role of Nb in improving cyclic stability is not known. In this study, we explore local structural changes in V0.25Ti0.25Cr0.5H2 and V0.25Ti0.25Cr0.45Nb0.05H2 by hydrogen cycling using the X-ray atomic pair distribution function (PDF) [5] and the extended X-ray absorption fine structure (EXAFS) spectra.
Experimental Summary
V0.25Ti0.25Cr0.5 and V0.25Ti0.25Cr0.45Nb0.05 were prepared and hydrogen cycling tests were conducted as described in Ref. 4. V0.25Ti0.25Cr0.45Nb0.05 shows only ~6% of reduction in capacity after ten cycles while V0.25Ti0.25Cr0.5 shows ~15% of reduction. Di-hydride samples, i.e. V0.25Ti0.25Cr0.5H2 at the first (V0.25Ti0.25Cr0.5H2-1) and the 10th (V0.25Ti0.25Cr0.5H2-10) cycles and V0.25Ti0.25Cr0.45Nb0.05H2 at the first (V0.25Ti0.25Cr0.45Nb0.05H2-1) and the 10th (V0.25Ti0.25Cr0.45Nb0.05H2-10) cycles were prepared for this study. Synchrotron X-ray total scattering experiments were conducted at BL22XU at SPring-8 [6]. An image plate detector (R-AXISV from Rigaku) was mounted orthogonal to an incident X-ray beam with a wavelength of 0.1769 Å (E = 70.09 keV). The X-ray PDFs were obtained by using the PDFgetX2 program [7]. Structural modeling in reciprocal space was carried out by the Rietveld method using the RIETAN-FP program [8]. For real space modeling the PDFgui program was used [9]. X-ray absorption fine structure (XAFS) experiments were carried out at BL14B1 at SPring-8 [10]. XAFS spectra at the V, Ti, Cr and Nb K-edges were collected at room temperature in transmission mode using an ion chamber. The ion chamber was filled with nitrogen for measurement at the V, Ti and Cr K-edges and with a mixture of nitrogen and argon for measurement at the Nb K-edge. The radial distribution functions (RDFs) were obtained by Fourier transformation of k3-weighted EXAFS function. The k-space interval of 2 ≤ k ≤ 9.55 Å-1 was used for transformation. EXAFS data reduction and modeling were performed using the ATHENA and the ARTEMIS programs, respectively [11].
Results and Discussion
The synchrotron X-ray diffraction data of all four samples were well explained by an face-centered cubic (fcc) structural model. For both compositions, the lattice parameters barely change but diffraction peaks broaden considerably during ten hydriding and dehydriding cycles. In addition, the amount of mono-hydride (V0.25Ti0.25Cr0.5H and V0.25Ti0.25Cr0.45Nb0.05H) increases with cycles. We previously found that the broadening of diffraction peaks by hydrogen cycling is mainly due to the formation of dislocations and dislocations play an important role in reduction in hydrogen storage capacity [12]. However, our PDF analysis results indicate that a similar number of dislocations were formed in V0.25Ti0.25Cr0.45Nb0.05H2 and V0.25Ti0.25Cr0.5H2 suggesting that improvement in cyclic stability by Nb substitution is not due to the suppression of the formation of dislocations. There seems to be another important factor that reduces hydrogen storage capacity. Since the amount of mono-hydride, which cannot transform into di-hydride, increases more rapidly in V0.25Ti0.25Cr0.5H2, this factor is probably responsible for an increase in such mono-hydride phase.
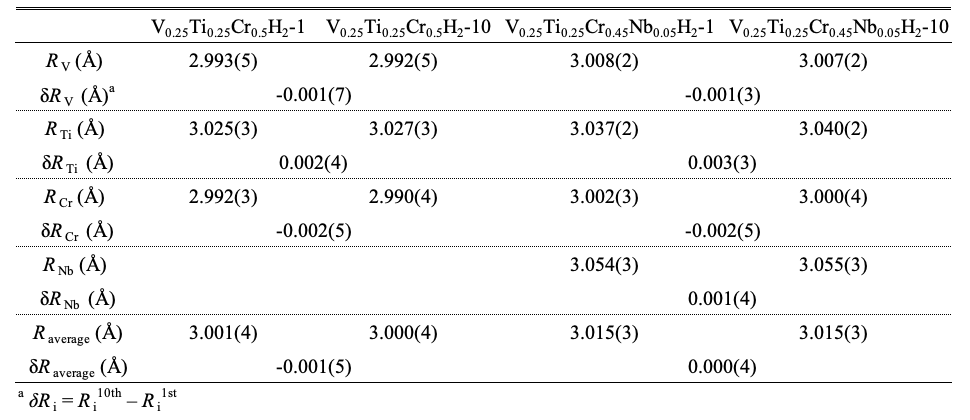
To find out this factor, we investigated element-specific local structure of di-hydride using RDFs obtained by Fourier transformation of EXAFS spectra. Since our main interest is metal-metal interaction, hereinafter the nearest neighbor (nn) distance refers to the shortest metal-to-metal distance in di-hydride for the sake of convenience. Using the fcc structural model, the average nn distances (Ri) were obtained (Table I). Interestingly, variation in Ri of each element by hydrogen cycling is not random. Although small, there is a definite tendency; the nn distance of a relatively small-sized atom like Cr (atomic radius = ratom = 1.28 Å) and V (ratom = 1.34 Å) becomes shorter and that of a relatively large-sized atom like Ti (ratom = 1.45 Å) and Nb (ratom = 1.46 Å) becomes longer. Similar tendency is also found in other V-based alloys indicating that this change is real, not an artifact of the method. Although change in bond length (relative bond length) from EXAFS spectra is small, it is possible to obtain meaningful information [13]. The most plausible explanation for the EXAFS result is that the segregation of small (Cr and V) and large (Ti and Nb) atoms occurs. As shown in Table I, δRV of two samples are comparable. However, in V0.25Ti0.25Cr0.5H2 the nn distance of Cr varies most, and in V0.25Ti0.25Cr0.45Nb0.05H2 that of Ti alters most. This suggests that segregation takes place somewhat differently in two samples. Furthermore, if we calculate the average metal-metal distance using Raverage=ΣifiRi, where fi is the atomic fraction of element i and Ri is the nn distance of element i obtained from EXAFS data, V0.25Ti0.25Cr0.5H2 shows a more discernible change in Raverage than V0.25Ti0.25Cr0.45Nb0.05H2 (Table I) indicating that more considerable segregation occurs in V0.25Ti0.25Cr0.5H2.
Table I. Average nearest neighbor distances (Ri) of V, Cr and Ti obtained from theoretical modeling of EXAFS spectra using the fcc (Fm-3m) model. Free parameters were interatomic distance and mean square displacement (Debye-Waller factor) only and other parameters were fixed.
To understand how atomic segregation occurs in each sample it is necessary to examine how the nn distances of constituent elements vary with the local atomic configuration first. This cannot be easily predicted for a ternary alloy composed of atoms in three distinctly different sizes. For this reason, we performed first-principles calculations employing the special quasi-random structure (SQS) approach [14]. A SQS is a small unit cell structure in which a small number of atoms closely reproduce the first few physically most relevant radial correlation functions of a perfectly random substitutional alloy. The models representing our sample compositions were constructed and relaxed. The average nn distance of each atom in the relaxed model was determined, the number of each surrounding element up to the second coordination shell was counted and the relation between them is shown in Figure 1. It turned out that the nn distances of Cr, V and Ti decrease (increase) as the number of surrounding Cr (Ti) atoms increases. An increase in the number of neighboring V makes the nn distance of Cr longer and that of Ti shorter. This is reasonable since the size of a V atom is larger than that of a Cr atom and is smaller than that of a Ti atom. However, it is unexpected that clustering of V atoms makes the nn distance of V shorter.
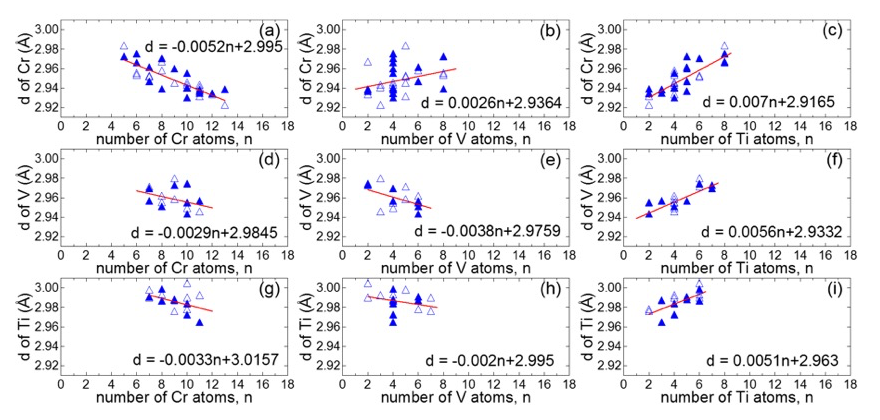
Fig.1 The average nn distance (d) as a function of the number of each surrounding element up to the second coordination shell obtained from the fully relaxed Cr16Ti8V8H64 (solid triangles) and Cr16V8Ti8H64 (open triangles) models. Solid lines represent the lines of best fit for all points.
This analysis reveals that the average nn distance of an atom is highly dependent on the kinds of surrounding atoms. The nn distances of Cr and Ti are largely affected by the number of neighboring Ti and that of Cr while the nn distance of V is mainly influenced by the number of Ti and that of V. This gives guidelines about how to evaluate change in the nn distance when the atomic configuration alters. To seek cases that give rise to similar δRi in Table I, we consider a simple system made up of small areas consisting of one V, one Ti and two Cr atoms (shaded areas in Figure 2), swap atoms between the small areas, evaluate whether the average nn distance of each atom becomes longer or shorter, and finally determine change in the average nn distance of each element in the system. To make it simple, we suppose that the nn distance of an atom is determined solely by the kinds of other three atoms in the shaded area that the atom belongs to.
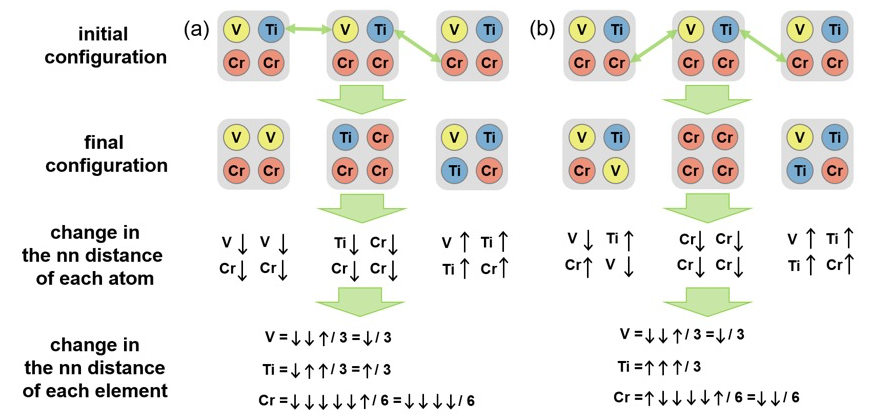
Fig. 2. Change in the average nn distance of each element of a system composed of three small areas after exchanging atoms. The cases that yield similar results to the EXAFS results of V0.25Ti0.25Cr0.5H2 and V0.25Ti0.25Cr0.45Nb0.05H2 are shown in (a) and (b), respectively.
A system comprised of three small areas was examined. Figure 2 shows two particular ways of exchanging atoms among the areas that yield similar results to Table I. An upward pointing arrow (↑) and a downward pointing arrow (↓) indicate, respectively, an increase and a decrease in the nn distance owing to atomic rearrangement. When swapping atoms in a way that is displayed in Figure 2(a), five of the Cr atoms encounter shortening of the nn distance and one of them encounters lengthening of the distance. Consequently, the average nn distance of Cr in this system becomes smaller. The magnitude of change in the average nn distance of Ti is comparable to that of V but smaller than that of Cr. This result closely resembles the EXAFS result for V0.25Ti0.25Cr0.5H2 in Table I. On the other hand, when exchanging atoms in a way shown in Figure 2(b), the largest change is seen in the average nn distance of Ti. Change in the average nn distance of V is equivalent to that of Cr. Overall changes are similar to those found in V0.25Ti0.25Cr0.45Nb0.05H2 (Table I). Therefore, the final configurations in Figure 2 somewhat reflect the characteristics of segregation occurring in V0.25Ti0.25Cr0.5H2 and V0.25Ti0.25Cr0.45Nb0.05H2.
A key difference in the final configurations in Figure 2 is that there are less numbers of areas composed of three elements in Figure 2(a) than in Figure 2(b). This suggests that more drastic segregation takes place in Figure 2(a), i.e. in V0.25Ti0.25Cr0.5H2. Theoretical studies have shown that the segregation of large atoms around dislocation cores can occur in semiconductor alloy thin films to release strain induced by dislocation cores [15]. Probably something similar happens in our case. A large number of dislocations formed during hydrogen cycling increase the strain energy of the system. The long and repetitive process of hydrogen uptake and release accompanying continuous structural change allows large Ti atoms drawn to dislocation cores to reduce the strain energy. This leaves Ti-poor regions nearby. The formation of Ti-poor regions is not favorable since Ti-poor composition (i.e. V and Cr-rich composition) requires higher hydrogen gas pressure for hydrogen uptake. Nb is slightly larger than Ti. Probably Nb reduces strain around dislocation cores more effectively than Ti. In this case, Nb is dragged to dislocation cores instead of Ti. This restrains the segregation of Ti to a certain extent and Ti concentration near dislocations does not vary significantly. Therefore, with the initial hydrogen gas pressure, Nb-containing samples can absorb more hydrogen during cycling leading to better cyclic stability. Interestingly, the final configurations in Figure 2 also reflect this aspect. Cr (Ti) is known to increase (decrease) the hydrogen uptake pressure of pure V. The small areas of V-V-Cr-Cr, Ti-Cr-Cr-Cr, and V-Ti-Ti-Cr in the final configuration of Figure 2(a) require, respectively, higher, higher, and lower hydrogen gas pressure for hydrogen uptake than the area of V-Ti-Cr-Cr. Meanwhile, the small areas of V-Ti-Cr-V, Cr-Cr-Cr-Cr, and V-Ti-Ti-Cr in Figure 2(b) require, respectively, lower, higher, lower hydrogen gas pressure. Therefore, the final configuration of Figure 2(b) would absorb more hydrogen than that of Figure 2(a) with the hydrogen uptake pressure of the initial configuration. Interstitial atoms like nitrogen or carbon are known to diffuse into dislocation cores. Ti-rich precipitates were found in V0.35Ti0.25Cr0.4 after 500 hydriding and dehydriding cycles, but not in carbon-added V0.35Ti0.25Cr0.4 [16]. This strongly supports our hypothesis.
Acknowledgments
This work is partly supported by the New Energy and Industrial Technology Development Organization (NEDO) under Feasibility Study on Advanced Hydrogen Storage Materials for Automotive Applications and by Photon and Quantum Basic Research Coordinated Development Program from the Ministry of Education, Culture, Sports, Science and Technology (MEXT), Japan.
Reference
[1] H. Itoh et al., J. Alloys Compd. 404-406, 417 (2005).
[2] M. Aoki et al., Int. J. Hydrogen Energy 36, 12329 (2011).
[3] S. Towata et al., J. Hydrogen Energy 38, 3024 (2013).
[4] S. Towata et al., J. Alloys Compd. 580, S226 (2013).
[5] T. Egami, S. J. L. Billinge, Underneath the Bragg Peaks: Structural Analysis of Complex Materials, Pergamon Press Elsevier, Oxford, 2003.
[6] T. Watanuki et al., Philos. Mag. 87, 2905 (2007).
[7] X. Qiu, J. W. Thompson, S. J. L. Billinge, J. Appl. Crystallogr. 37, 678 (2004).
[8] F. Izumi, K. Momma, Solid State Phenom. 130, 15 (2007).
[9] C. L. Farrow et al., J. Phys.: Condens. Matter 19, 335219 (2007).
[10] H. Hiraka et al., Phys. Rev. Lett. 102, 037002 (2009).
[11] B. Ravel, M. Newville, J. Synchrotron Rad. 12, 537 (2005).
[12] H. Kim et al., J. Phys. Chem. C 117, 26543 (2013).
[13] J. Purans et al., Phys. Rev. Lett. 100, 055901 (2008).
[14] A. Zunger et al., Phys. Rev. Lett. 65, 353 (1990).
[15] M. K. Horton et al., Nano Lett. 15, 923 (2015).
[16] C.-C. Shen, H.-C. Li, J. Alloys Compd. 648, 534 (2015).

(Received: July 1, 2019; Early edition: May 27, 2020; Accepted: July 6, 2020; Published: August 21, 2020)