


Volume8 No.2
Section A : Scientific Research Report
Effect of Hydrogen on the Sound Velocity of fcc-Fe at High Pressures and High Temperatures
aNational Institute for Materials Science, bThe University of Tokyo, cTohoku University, dOsaka University, eJASRI
- Abstract
-
We have performed the measurements of the sound velocities of fcc-FeHx and fcc-Fe by using a pulse-echo overlap technique at high pressures and high temperatures at BL04B1. The P-wave velocity (VP) of fcc-FeHx (x~0.4) at approximately 12.0 GPa and 900 K was same as that of fcc-Fe, indicating no hydrogen effect on VP of fcc-Fe under that pressure-, temperature-, and hydrogen-conditions.
Keywords:sound velocity, iron hydride, high pressure, ultrasonic method
Background and Purpose:
The planetary cores are considered to be composed of iron (Fe) with considerable amount of light elements [1]. Understanding effects of the light elements on physical properties, such as density and sound velocity, of Fe is fundamental to discuss the cores’ compositions. Hydrogen is one of plausible light elements.
Effect of hydrogen on the density of Fe has been investigated for the body-centered cubic (bcc), face-centered cubic (fcc), and hexagonal close-packed (hcp) structures under high-pressure and high-temperature conditions, and it is known that hydrogen lowers the densities of bcc-, fcc-, and hcp-Fe [2-4]. The sound velocities of iron hydride (FeHx) have been reported for a fcc structure [5] and a double hexagonal close-packed (dhcp) structure [6, 7] which is formed by dissolving hydrogen into hcp-Fe. Regarding dhcp-FeH, it has been shown that the hydrogen increases the sound velocity of hcp-Fe at a given pressure, at least up to 70 GPa at room temperature [6, 7]. In contrast, the effect of hydrogen on fcc-Fe is still unclear due to limited data of the sound velocities of fcc-FeHx and fcc-Fe at high temperatures and high pressures. In this study, we have developed the cell assembly for the sound-velocity measurements of FeHx with a pulse-echo overlap technique at high pressures and high temperatures, and measured the sound velocities of both fcc-FeHx and fcc-Fe.
Experimental Summary:
High-pressure and high-temperature experiments were performed using a Kawai-type 1500-ton multianvil high-pressure apparatus (SPEED-1500) installed at the BL04B1 beamline. We used a 14/8 cell assembly (14 mm octahedron edge length and 8 mm truncated edge length of tungsten carbide cubic anvils). Figure 1 shows schematic illustrations of the cell assemblies used in this study. Iron powder (99.99% purity, Rare Metallic Co. Ltd.) was used as a starting material, which was sandwiched by an yttrium-stabilized zirconia (YSZ) in order to keep the bottom side of the sample parallel to that top side, and surrounded by NaCl (Fig. 1a) or hexagonal BN (Fig. 1b) capsules for FeHx or Fe, respectively. NaCl is known to seal the hydrogen inside the capsule and has been used for the high-pressure and high-temperature experiments on FeHx [8]. Hydrogen was supplied to the sample by the thermal decomposition of LiAlH4 [9], which was packed into the bottom of the NaCl capsule (Fig. 1a). A powdered mixture of MgO and NaCl, placed just behind the capsule, was used as a pressure marker. The experimental temperatures and pressures were estimated based on two equations of state, i.e., those for MgO [10] and NaCl [11]. The unit-cell volumes of the sample and the pressure markers were determined based on an energy-dispersive X-ray diffraction measurement. A Ge solid-state detector was placed at a fixed angle of approximately 6º from the incident X-ray beam.
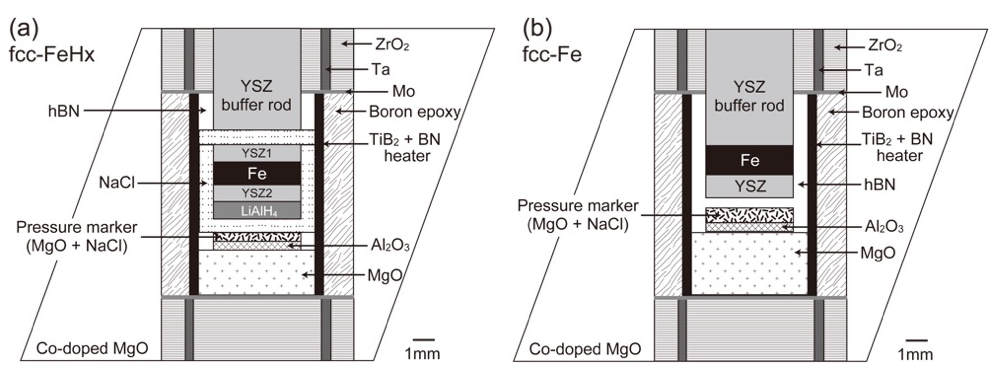
Figure 1. Cell assemblies used in this study for (a) fcc-FeHx and (b) fcc-Fe.
Ultrasonic sound-velocity measurements were performed using a pulse-echo overlap technique [12]. Both P- and S-wave signals were generated and received by a 10º Y-cut LiNbO3 transducer with a thickness of 0.05 mm and diameter of 3.2 mm. The frequencies used in this study were 60 and 42 MHz for P- and S-waves, respectively. The sound velocity was estimated by dividing the sample length, which was measured from an X-ray radiography image, by the travel time obtained by a digital oscilloscope.
First, we increased the pressure to the target pressure and increased the temperature to the highest temperature in order to reduce the deviatoric stress imposed on the sample during compression, and synthesized FeHx. We then collected the ultrasonic, X-ray radiography, and X-ray diffraction data every 100–150 K while decreasing the temperature.
In metal hydrides, hydrogen atoms occupy interstitial sites of metal lattices and the atomic volume of the host metal expands. Thus, the hydrogen concentration (x) in a metal hydride, MHx, can be roughly estimated from the following expression:
x = [V(MHx)-V(M)]/VH (1)
where V(MHx), V(M), and VH denote the atomic volumes of the metal hydride and host metal, and the volume increase per hydrogen atom, respectively [8]. V(FeHx) were directly measured by in situ X-ray diffraction experiments, and V(fcc-Fe) were estimated from the previous volume data [13]. For values of VH, we follow the previous studies, i.e., 1.9 Å3 [e.g., 2].
Result and Discussion:
The experimental conditions and results are summarized in Table 1. Hydrogen concentrations in fcc-FeHx were x = 0.10–0.14 and 0.40–0.43 at approximately 7 and 12 GPa, respectively. We calculated the adiabatic bulk (KS) and shear (G) moduli using the following relationships:
Ks = (VP2-4/3VS2)ρ and G = VS2ρ (2)
where VP and VS are P- and S-wave velocities, respectively, and ρ is the density. In this study, we could obtain only P-wave signals for fcc-FeHx, while both P- and S-wave signals for fcc-Fe were obtained. Examples of the P-wave signal of fcc-FeHx and X-ray radiography image obtained at 6.9 GPa and 896 K are shown in Fig. 2. The amplitudes of the echoes from the YSZ1/sample and the sample/YSZ2 were low compared with others due to the small difference in impedance between the sample and YSZ, but the signal-to-noise ratios were sufficient to determine the travel time (Fig. 2a insert).
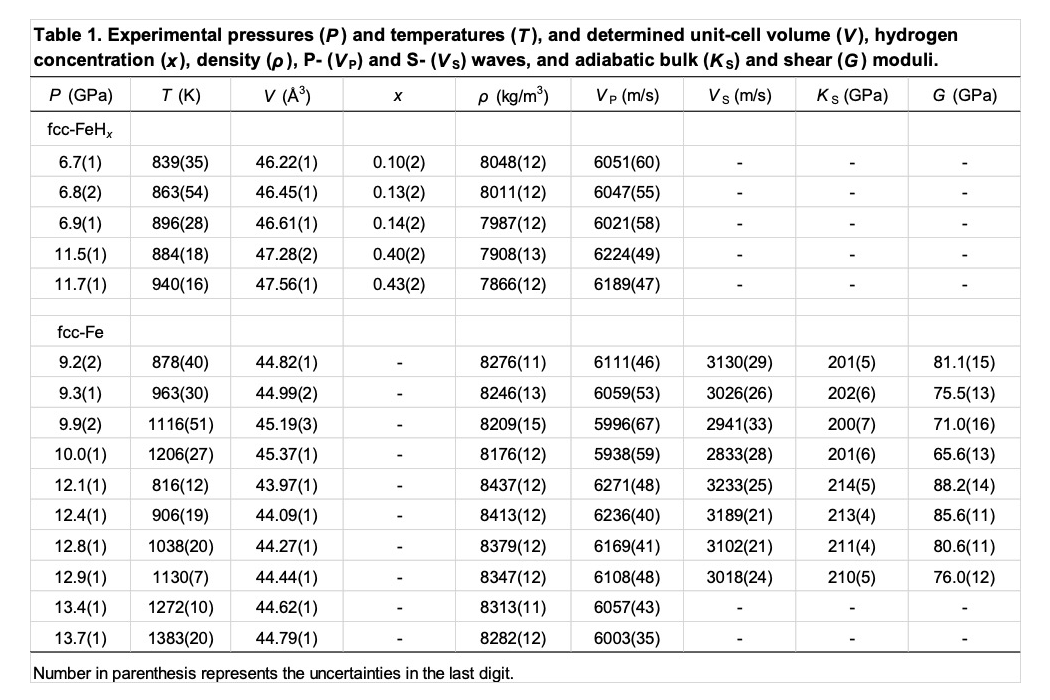
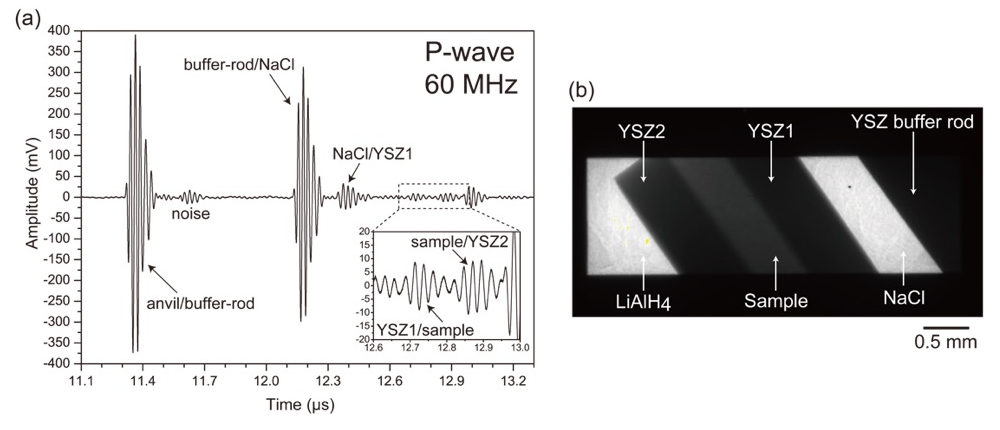
Figure 2. (a) Example of P-wave signals and (b) X-ray radiography image obtained at 6.9 GPa and 896 K.
Figures 3 shows the pressure dependences of VP and VS for fcc-FeHx and fcc-Fe. Both VP and VS of fcc-Fe increased with increasing pressure and decreased with increasing temperature. Estimating the temperature dependences of VP and VS, dVP,S/dT, for fcc-Fe using the data between approximately 900 and 1100 K, we obtained the values of -0.49(5) and -0.77(20) for VP and VS, respectively, at 9.2–9.9 GPa, and those of -0.56(4) and -0.75(7) for VP and VS, respectively, at 12.4–12.9 GPa. It indicates that the temperature dependence of VS is larger than that of VP, whereas the dVP,S/dT shows no pressure dependence in the pressure range in this study, which is the same as the results of bcc-Fe [14]. The VP of fcc-FeHx also appears to exhibit the negative temperature dependence (Fig. 3a), while the pressure dependence of VP is unclear because the hydrogen concentrations in fcc-FeHx in this study are different between two pressure conditions: x = 0.10–0.14 at 6.7–6.9 GPa and x = 0.40–0.43 at 11.5–11.7 GPa (Table 1).
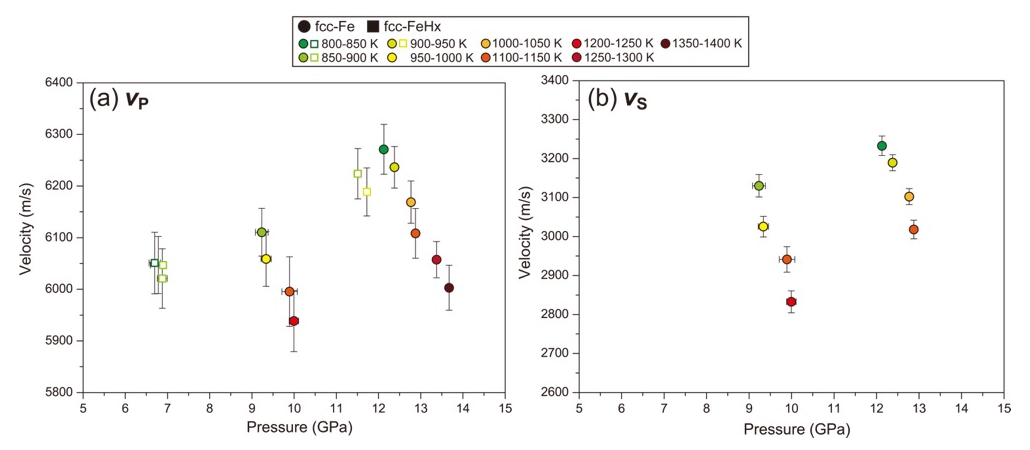
Figure 3. Obtained (a) VP and (b) VS as a function of pressure.
Comparing VP between fcc-FeHx [6224(49) m/s at 11.5(1) GPa and 884(18) K] and fcc-Fe [6236(40) m/s at 12.4(1) GPa and 906(19) K], it is considered that the hydrogen shows no effect on VP of fcc-Fe, at least at this pressure-, temperature-, and hydrogen-conditions. Because the decrease of ρ by dissolving hydrogen (Table 1) would induce the increase of VP considering the relationship of VP2 = (KS+4/3G)/ρ, the similar values of VP between fcc-FeHx and fcc-Fe imply that the hydrogen significantly reduces KS and/or G of fcc-Fe. This is consistent with results of the previous studies; the isothermal bulk modulus at ambient condition, KT0, is 99 GPa for fcc-FeHx [15], while that is 139 GPa for fcc-Fe [13]. On the other hand, based on the previous studies of dhcp-FeH [6] and hcp-Fe [16], the VP of dhcp-FeH (7035 m/s) is higher than that of hcp-Fe (6850 m/s) at 15 GPa. This difference of the hydrogen effect between fcc-Fe and hcp-Fe may come from the difference of hydrogen concentrations, suggested by Thompson et al. (2018) [5], because of x ~ 0.4 in fcc-FeHx in this study while x ~ 1 in dhcp-FeH in the previous studies [6, 7], as well as the difference of structures between the fcc and dhcp phases. Further investigations on the sound velocities of fcc-FeHx and dhcp-FeH in the wide range of pressure and temperature conditions with varying x values are required to advance understanding of the effects of hydrogen on the sound velocity of Fe.
Challenge:
We could measure the VP of fcc-FeHx at high pressures and high temperatures by using newly developed cell assemblies. However, to measure VS of fcc-FeHx is still unachieved. The cause is probably the large reflection at the boundary of the YSZ buffer rod and NaCl due to the large difference in acoustic impedance of S-waves between the YSZ and NaCl. As a next step, we will adopt other materials such as a Si3N4 [17] as the buffer rod instead of YSZ, and address the problem of measuring the VS of fcc-FeHx which is crucial to obtain KS and G of fcc-FeHx directly.
In addition, in order to understand the effect of hydrogen on VP and VS of Fe more precisely, it is important to obtain the VP and VS data for FeHx with various x values. We have already checked that it is possible to control the hydrogen concentration in FeHx by changing the amount of LiAlH4. We will also perform the sound-velocity measurements of fcc-FeHx with various x values.
Acknowledgements:
This work was supported by JSPS KAKENHI Grant Number 15K17784 for Y.S.
References:
[1] F. Birch, J. Geophys. Res. 57, 227 (1952).
[2] T. Hiroi, Y. Fukai, K. Mori, J. Alloys Comp. 404-406, 252 (2005).
[3] K. Sakamaki et al., Phys. Earth Planet. Inter. 174, 192 (2009).
[4] N. Hirao et al., Geophys. Res. Lett. 31, L06616 (2004).
[5] E. C. Thompson et al., Geochem, Geophys., Geosystems 19, 305 (2018).
[6] Y. Shibazaki et al., Earth Planet. Sci. Lett. 313-314, 79 (2012).
[7] W. L. Mao et al., Geophys. Res. Lett. 31, L15618 (2004).
[8] Y. Fukai, High-Pressure Research: Application to Earth and Planetary Sciences, Y. Syono, M. H. Manghnani, ed., TERRAPUB, 1992, 373.
[9] J. R. Ares et al., Mater. Res. Bull. 43, 1263 (2008).
[10] Y. Tange, Y. Nishihara, T. Tsuchiya, J. Geophys. Res. 114, B03208 (2009).
[11] M. Matsui et al., Am. Mineral. 97, 1670 (2012).
[12] Y. Higo et al., J. Synchrotron Rad. 16, 762 (2009).
[13] N. Tsujino et al., Earth Planet. Sci. Lett. 375, 244 (2013).
[14] Y. Shibazaki et al., Am. Mineral. 101, 1150 (2016).
[15] O. Narygina et al., Earth Planet. Sci. Lett. 307, 409 (2011).
[16] E. Ohtani et al., Geophys. Res. Lett. 40, 1 (2013).
[17] Y. Higo, T. Irifune, K. Funakoshi, Rev. Sci. Instrum. 89, 014501 (2018).

(Received: March 31, 2019; Early edition: January 29, 2020; Accepted: July 6, 2020; Published: August 21, 2020)