


Volume8 No.1
SPring-8 Section A: Scientific Research Report
Unusual Volume Reduction in CaLi2-xMgx by Hydrogen Uptake
a AIST, b QST, c JAEA, d Kyushu University
- Abstract
-
To understand the hydrogen storage properties of CaLi2-xMgx having a C14 Laves phase structure, changes in its average and local structures by hydrogenation were investigated by using the Rietveld and the atomic pair distribution function analyses of X-ray diffraction data. We found that after hydrogen uptake at 283 K, Mg-containing samples exhibit a C14 phase with reduced volume. This C14 phase readily decomposes into CaH2 at temperatures higher than 300 K. Our study suggests that hydrogen absorption in CaLi2-xMgx at 283 K is multi-step reaction. Lithium that can easily diffuse through C14 crystals reacts with hydrogen forming a Li-rich hydride phase. On the other hand, slow diffusion of large Ca atoms and strong Mg-Mg and Mg-Ca interaction restrain the immediate formation of CaH2. As a result, there is a substantial time lag between the formation of a Li-rich hydride phase and the formation of CaH2 at 283 K. This brings about a C14 phase with reduced volume where a large number of Li vacancies are present immediately after hydrogenation.
Keywords: C14 Laves phase, hydrogen absorbing materials, X-ray diffraction, atomic pair distribution function
Background and Purpose
It has been reported that Li-rich CaLi2-xMgx (x>0) having a C14 Laves phase structure, a hexagonal MgZn2-type structure (P63/mmc space group), absorbs hydrogen at ambient temperature without altering a crystal structure type [1]. These hydrogen absorption properties are unusual since AB2 Laves phase materials composed solely of light metals, such as Ca, Mg and/or Al, typically require temperatures higher than 473 K to react with hydrogen and easily decompose into CaH2, Mg and/or Al during hydrogen uptake [2]. Despite of these interesting properties, a detailed structural study on CaLi2-xMgx has not been conducted. In this study, we conduct a thorough structural study of CaLi2-xMgx using Rietveld and atomic pair distribution function (PDF) analyses of Synchrotron X-ray total scattering data.
Experimental Summary
Pressure-composition isotherm (PCT) measurement of CaLi2-xMgx, x=0, 0.5, and 1 was carried out at 248 K for CaLi2 and 283 K for CaLi1.5Mg0.5 and CaLiMg. Synchrotron X-ray total scattering experiments were carried out at BL22XU [3] and BL14B1 [4] beamlines at SPring-8. For the experiment at BL22XU, fine powder samples of CaLi2, CaLi1.5Mg0.5, CaLiMg and hydrogenated CaLiMg kept at room temperature for more than three years were loaded in kapton capillaries with a diameter of 1.0 mm. Data were collected at room temperature with a large image plate (IP) detector, R-AXIS V manufactured by Rigaku [3]. The incident X-ray beam of 70.16 keV (λ=0.1768 Å) and 70.430 keV (λ=0.17604 Å) were used. For the experiment at BL14B1, a fine powder sample of hydrogenated CaLiMg kept at 282 K for a week and that kept at room temperature for a week were loaded between kapton tapes and placed in a square-shaped sample holder made of copper. The sample holder was mounted on a κ-type multi-axis diffractometer coupled with a NaI scintillation detector and shielded with beryllium windows [4]. Each sample was cooled down to 263 K using a closed-cycle helium gas refrigerator and total scattering data were collected with an incident X-ray energy of 60.2684 keV (λ=0.205720 Å). The PDFgetX2 program [5] was used for processing the X-ray PDFs. Structural modeling in reciprocal space was carried out by the Rietveld method using the RIETAN-FP program [6]. For local structural studies, the PDFgui program [7] was used for real space modeling.
Results and Discussion
PCT measurement shows that CaLi2 absorbs H/M (the number ratio of hydrogen to metal atoms) ~1.2 of hydrogen. This corresponds to ~6.7 mass% of hydrogen. The amount of absorbed hydrogen by CaLi1.5Mg0.5 is H/M~1 (~4.8 mass%) and that by CaLiMg is H/M~0.5 (~2.1 mass%).
Rietveld analysis results using synchrotron X-ray total scattering data show that main diffraction peaks of CaLi2-xMgx, x=0, 0.5 data are well explained by a C14 Laves phase structural model. The refined lattice parameters are a =6.2709(7) Å and c =10.232(1) Å for CaLi2, a =6.2463(6) Å and c =10.1947(9) Å for CaLi1.5Mg0.5, and a =6.2361(5) Å and c =10.1916(9) Å for CaLiMg. The C14 structural model also explains the overall features of the X-ray PDFs of CaLi2-xMgx below 20 Å indicating that the local structure does not deviate significantly from the average structure.
X-ray diffraction patterns of CaLi2 after PCT measurement obtained using Cu Kα radiation show diffraction peaks of CaH2 and LiH indicating that CaLi2 is decomposed by hydrogenation. Meanwhile, CaLi1.5Mg0.5 after hydrogenation does not show neither CaH2 nor LiH diffraction peaks. Instead, small diffraction peaks of a C14 Laves phase were observed (Fig. 1(a)). Compared to the diffraction lines before hydrogenation, these peaks all shift to higher 2θ. This is somewhat peculiar since hydrogen uptake usually leads to appreciable volume expansion in conventional metals, metal alloys and intermetallic compounds often accompanying change in structure types. When the structure type remains unchanged, volume expansion emerges as a considerable shift of diffraction peaks to lower 2θ. However, peak shifts seen in Fig. 1(a) occur in the opposite direction indicating the shrinkage of the C14 lattice. Moreover, there is a very broad hump underneath these diffraction peaks. In fact, we noticed that the hydrogenated CaLi1.5Mg0.5 sample is composed of silvery particles and gray particles. Although difficult, it is not impossible to separate the gray particles from the silvery ones. The gray particles were pulverized without difficulty. The X-ray diffraction pattern of gray powder (a green line in Fig. 1(a)) coincides well with the broad hump found underneath the diffraction peaks after hydrogenation. This strongly suggests that during hydrogen uptake some of metal atoms are dissociated from the C14 crystals and involved in the formation of an amorphous-like phase. CaLiMg, a Mg-richer sample, also displays unusual volume reduction (Fig. 1(b)). However, there are several characteristics distinct from CaLi1.5Mg0.5. First of all, even after hydrogenation the diffraction peaks remain relatively sharp. Some of the peaks show a drastic diminution in intensity. In addition, no distinct broad hump underneath the diffraction peaks of a C14 phase is present and no sign of CaH2 or LiH is seen. Furthermore, peak shifts in CaLiMg are much smaller than those in CaLi1.5Mg0.5. Volume reduction is roughly assessed at 6.4 % for CaLi1.5Mg0.5 and 2.1 % for CaLiMg. Note that the extent of a peak shift varies from peak to peak indicating that there is a certain direction along which lattice contraction takes place predominantly. In fact, for both samples, the c-axis lattice parameter decreases (-2.7 % for CaLi1.5Mg0.5 and -1.0 % for CaLiMg) more than the a- or b-axis lattice parameter (-2.0 % for CaLi1.5Mg0.5 and -0.6 % for CaLiMg).
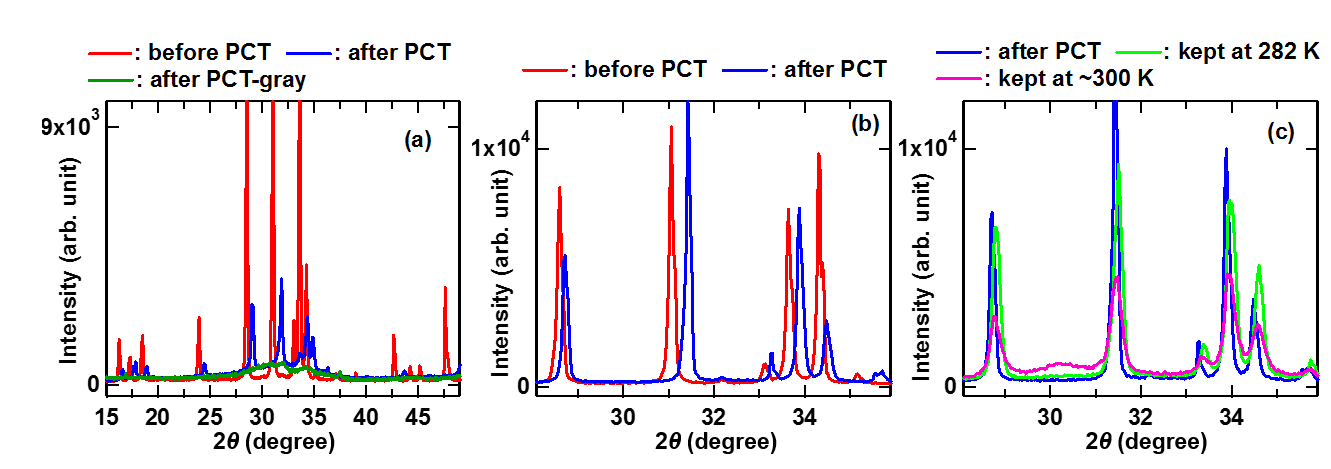
Fig. 1. X-ray diffraction patterns of (a) CaLi1.5Mg0.5 (b) CaLiMg before and after PCT measurement using Cu Kα radiation. (c) X-ray diffraction patterns of hydrogenated CaLiMg kept at 282 K and 300 K are shown.
The results so far reveal an interesting correlation. A sample with a higher lithium content absorbs more hydrogen and shows greater volume reduction. The atomic fraction of calcium is equal for all the samples and both the amount of absorbed hydrogen and the extent of volume reduction decrease with increasing the magnesium content. Therefore, lithium seems to play a critical role in hydrogen uptake in CaLi2-xMgx. It is most reasonable to conclude that when CaLi2-xMgx (x>0) reacts with hydrogen, some of Li atoms are freed from the C14 crystals forming a Li-rich hydride phase like LiH or Li-rich Li-X-H (X = Ca or/and Mg). However, owing to low experimental temperature (283 K), the structural correlation of the Li-rich hydride phase is not well defined consequently leading to an amorphous-like broad diffraction pattern as clearly seen in Fig. 1(a). The removal of lithium from CaLi2-xMgx leaves vacancies in the lattice and these vacancies should contributes greatly to the unusual volume reduction of the C14 phase. Since peak shifts found in Fig. 1(a) and (b) are large, a fair number of vacancies should be formed. Furthermore, to have such apparent diffraction peaks C14 structural characteristics should remain to a certain degree in the presence of a large number of vacancies. Our first principles calculations show that one Li vacancy in a unit cell induces similar diffraction peak shifts as the experimental data indicating that C14 structural characteristics can remain.
To study the stability of the C14 phase remaining after hydrogen uptake (henceforth, we call it a hydrogenated C14 phase) we kept hydrogenated CaLiMg at two different temperatures, 282 K (CaLiMg-H-282 K) and 300 K (CaLiMg-H-300 K), in an argon atmosphere for a week and examined changes in their structures. The sample kept at 282 K exhibits little broadened yet still intense C14 diffraction peaks (Fig. 1(c)). No apparent new peaks appear. However, a slight increase in temperature to 300 K triggers considerable changes (a magenta line in Fig. 1(c)). Diffraction peaks get more broadened than those of CaLiMg-H-282 K, and peak intensities significantly diminish. Moreover, a new broad peak emerges at 2θ ≈ 30° compensating for the loss of C14 diffraction peak intensity. These results strongly suggest that the hydrogenated C14 phase is unstable at 300 K and easily decomposes.
To further investigate changes in the hydrogenated C14 phase at 300 K, we obtained the synchrotron X-ray PDFs of CaLiMg-H-282 K and CaLiMg-H-300 K. A C14 structural model that does not contain hydrogen atoms was refined until the best agreement to the experimental PDF data was obtained, and then features that were not explained by the model were examined. PDF fitting results are shown in Fig. 2(a)-(c). Although it is not entirely satisfactory, the model reproduces the overall PDF profile of CaLiMg-H-282 K to a reasonable degree (Fig. 2(a)). For the case of CaLiMg-H-300 K, however, disagreement between the data and the model is apparent; not only peak intensities but also the positions and shapes of some peaks are poorly explained (Fig. 2(b)). As shown in Fig. 2(c), a much worse fit was obtained for the sample kept at 300 K for more than three years indicating that this change is extremely slow and not complete in a week. Interestingly, we found that the difference curves in Fig. 2(a)-(c) contain information about the development of CaH2 structural correlation. In Fig. 2(d)-(f), the difference curves obtained in Fig. 2(a)-(c) are compared to the calculated CaH2 PDF. For the difference curve of CaLiMg-H-282 K (Fig. 2(d)), a sharp feature at ~3.8 Å is aligned with the first PDF peak of CaH2 and there is a hint of CaH2-like features in 4 < r < 9 Å. However, features in r > 9 Å do not match those of CaH2. This is similar to the case of an amorphous PDF, where a sharp first peak is followed by two or three broad peaks reflecting the presence of short-range structural order. This indicates that CaH2 structural correlation in CaLiMg-H-282 K is poorly developed at this stage. For the difference curve of CaLiMg-H-300K (Fig. 2(e)), intensity fluctuation in r < ~14 Å resembles the CaH2 PDF indicating the development of short-to-medium range structural order of CaH2. As time passes, the CaH2 structural correlation becomes more apparent and extends over a much longer-r range (Fig. 2(f)). Therefore, the new broad peak appearing at 2θ ≈30° in Fig. 1(c) is from CaH2. These PDF results clearly demonstrate that the hydrogenated C14 phase easily decomposes into CaH2 at 300 K.

Fig. 2. PDF refinement results. The experimental X-ray PDFs of (a) CaLiMg-H-282 K, (b) CaLiMg-H-300 K, and (c) the hydrogenated CaLiMg sample kept at 300 K for more than three years are plotted with calculated PDFs using refined C14 structural models. Difference between the experimental and calculated PDFs is plotted below the data in each panel for clarity. Difference curves obtained from PDF modeling using data of (d) CaLiMg-H-282 K, (e) CaLiMg-H-300 K, and (f) the hydrogenated CaLiMg sample kept at 300 K for more than three years are compared to the calculated PDF of CaH2.
Making use of the results obtained, we are able to understand the hydrogen absorption process in CaLi2-xMgx to some extent. A sample with a high lithium content absorbs a larger amount of hydrogen, undergoes a greater volume reduction, and exhibits a more intense amorphous-like background than one with a low lithium content. This strongly suggests that during hydrogen uptake some of Li atoms pulled out of the crystals resulting in unusual hydrogenation-induced volume reduction. According to the theoretical study of Ref. [8], the structural stability of CaLi2-xMgx increases with the magnesium content owing to strong Mg-Mg and Mg-Ca bonds. Probably these strong Mg-Mg and Mg-Ca bonds limit the dissociation of Li preventing the C14 crystals from completely collapsing.
Change in the hydrogenated C14 phase at 300 K provides us more information. As seen in Fig. 1(c), the arising of a CaH2 peak and the decreasing of C14 peak intensities occur concurrently. This indicates that Ca atoms are easily dissociated from the hydrogenated C14 phase at 300 K. Hydrogen was probably dragged from the Li-rich hydride phase to form CaH2. Alternatively, the hydrogenated C14 phase might contain some hydrogen. Then, what is the reason that CaH2 did not form in the first place despite of its high stability (the formation enthalpy of CaH2, LiH, and MgH2 are -174.5, -157.3, and -74.5 kJ/mol H2, respectively [9])? This is because of the slow diffusion of large Ca atoms at 283 K. Chemical frustration of large atoms at low temperatures often leads to the formation of a single amorphous hydride phase [10]. In our case, however, the presence of lithium yields a totally different outcome. Small Li atoms can easily diffuse through crystals even at 283 K. This ability of lithium allows CaLi2-xMgx to react with hydrogen at ambient conditions. Note that CaMg2, lithium-free composition, does not absorb hydrogen at ambient conditions [2]. On the other hand, slow Ca diffusion and strong Mg-Mg and Mg-Ca interaction work together to obstruct the immediate formation of CaH2. Consequently, only Li atoms are freed from C14 crystals forming a Li-rich amorphous-like hydride phase and leaving a Li-poor C14 phase behind. Numerous vacant sites resulting from the removal of lithium allow large Ca atoms to migrate more easily. This is the reason why CaH2 can be easily formed when the hydrogenated C14 phase is exposed to slightly higher temperatures than 283 K. In fact, the formation of CaH2 was also observed in the hydrogenated CaLiMg sample kept at 282 K for a long period of time indicating that the diffusion of Ca atoms is extremely slow at 282 K.
As we have discussed so far, the hydriding process of CaLi2-xMgx (x>0) at 283 K is at least two-step process; a Li-rich hydride phase forms first and then the formation of CaH2 takes place over a long period of time. As a result, there is a substantial time lag between the formation of a Li-rich hydride phase and the formation of CaH2 at 283 K. This brings about a C14 phase with reduced volume where a large number of Li vacancies are present immediately after hydrogenation. At temperatures higher than 300 K, however, these two seem to occur almost simultaneously. In the earlier study, volume reduction by hydrogen uptake was not reported [1]. Although CaLi2-xMgx was hydrogenated at two different temperatures, 283 K and 313 K, in Ref. [1], it was not mentioned which temperature X-ray diffraction patterns correspond to. We speculate that the diffraction patterns correspond to the samples hydrogenated at 313 K because all of them display a CaH2 peak. Hence, CaLi2-xMgx directly decomposed into LiH and CaH2 and the unreacted part of the sample gave rise to the diffraction peaks of a C14 phase with no volume reduction.
References
[1] K. Asano et al., J. Alloys Compd. 482, L18-L21 (2009).
[2] N. Terashita, E. Akiba, Mater. Trans. 45, 2594-2597 (2004).
[3] T. Watanuki et al., Philos. Mag. 87, 2905-2911 (2007).
[4] Y. Yoneda et al., J. Synchrotron Radiat. 8, 18-21 (2001).
[5] X. Qiu, J. W. Thompson, S. J. L. Billinge, J. Appl. Crystallogr. 37, 678 (2004).
[6] F. Izumi, K. Momma, Solid State Phenom. 130, 15-20 (2007).
[7] C. L. Farrow et al., J. Phys.: Condens. Matter 19, 335219 (2007).
[8] Z.-S. Mo et al., Phys. Scr. 84, 055603 (2011).
[9] Y. Fukai, The Metal-Hydrogen System: Basic Bulk Properties, second ed., Springer, Berlin, 2005.
[10] X. L. Yeh, K. Samwer, W. L. Johnson, Appl. Phys. Lett. 42, 242-244 (1983).

ⒸJASRI
(Received: June 12, 2019; Early edition: September 30, 2019; Accepted: December 16, 2019; Published: January 22, 2020)